ホーム » 不偏推定量
「不偏推定量」カテゴリーアーカイブ
2015 Q1(2)
不偏分散が母分散の不偏推定量である事を示しました。
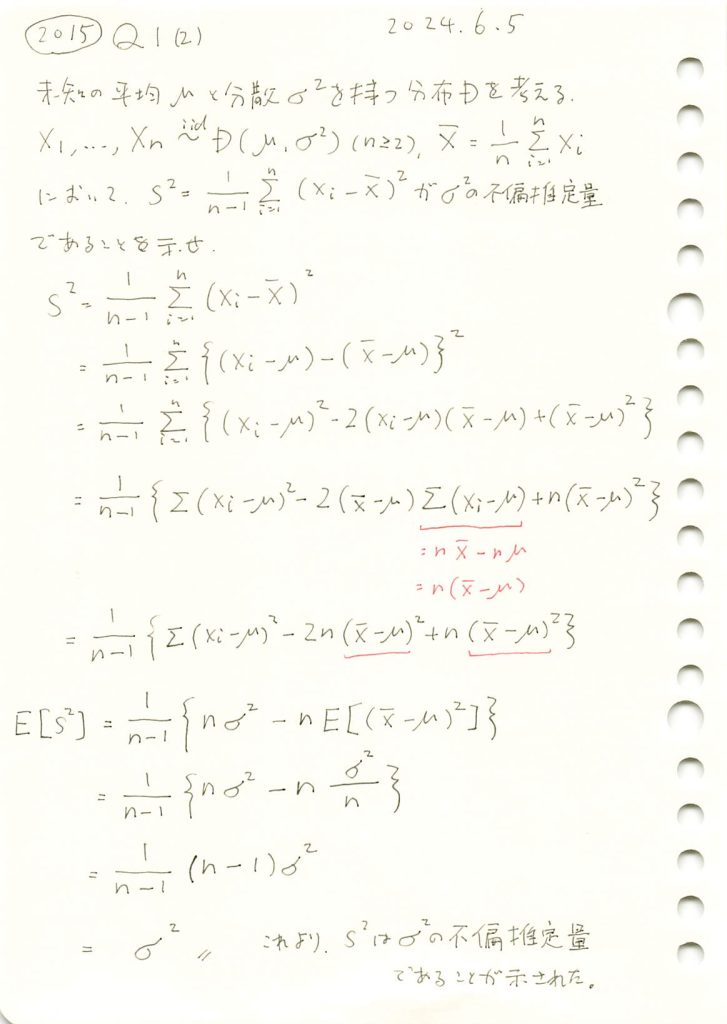
コード
※2018 Q1(1)から引用https://statistics.blue/2018-q11/
nを2~100に変化させて、不偏分散と標本分散を比較してみます。
import numpy as np
import matplotlib.pyplot as plt

# パラメータ設定
mu = 0      # 母集団平均
sigma = 2   # 母集団標準偏差
sigma_squared = sigma ** 2  # 真の母分散
n_values = range(2, 101, 2)  # サンプルサイズ n を2から100まで2ステップで変化させる
num_trials = 3000  # 各 n に対して100回の試行を行う

# 不偏分散 (1/(n-1)) と 標本分散 (1/n) を計算するためのリスト
unbiased_variances = []
biased_variances = []

# 各サンプルサイズ n で分散を計算
for n in n_values:
    unbiased_variance_sum = 0
    biased_variance_sum = 0

    # 各サンプルサイズ n に対して複数回試行して平均を計算
    for _ in range(num_trials):
        # 正規分布に従うサンプルを生成
        sample = np.random.normal(mu, sigma, n)

        # 標本平均
        sample_mean = np.mean(sample)

        # 不偏分散 (1/(n-1))
        unbiased_variance = np.sum((sample - sample_mean) ** 2) / (n - 1)
        unbiased_variance_sum += unbiased_variance

        # 標本分散 (1/n)
        biased_variance = np.sum((sample - sample_mean) ** 2) / n
        biased_variance_sum += biased_variance

    # 各 n に対する平均分散をリストに追加
    unbiased_variances.append(unbiased_variance_sum / num_trials)
    biased_variances.append(biased_variance_sum / num_trials)

# グラフを描画
plt.plot(n_values, unbiased_variances, label="不偏分散 (1/(n-1))", color='blue', marker='o')
plt.plot(n_values, biased_variances, label="標本分散 (1/n)", color='red', linestyle='--', marker='x')

# 真の分散を水平線で描画
plt.axhline(y=sigma_squared, color='green', linestyle='-', label=f'真の分散 = {sigma_squared}')

# グラフの設定
plt.title('サンプルサイズに対する標本分散と不偏分散の比較')
plt.xlabel('サンプルサイズ n')
plt.ylabel('分散')
plt.legend()
plt.grid(True)
plt.show()
標本分散には不偏性はなく、不偏分散には不偏性があることが確認できました。
次に、![]() と
と![]() を棒グラフで比較してみます。
を棒グラフで比較してみます。
# 2015 Q1(2)  2024.12.3

import numpy as np
import matplotlib.pyplot as plt

# パラメータ設定
mu = 0      # 母平均
sigma = 2   # 母標準偏差
n = 10      # 標本サイズ
num_simulations = 30  # シミュレーション回数

# 共通のシミュレーションサンプルを生成
samples = [np.random.normal(mu, sigma, n) for _ in range(num_simulations)]

# 各シミュレーションで E[(X - X̄)^2] と E[(X - μ)^2] を計算
var_sample_mean = [np.mean((sample - np.mean(sample))**2) for sample in samples]  # E[(X - X̄)^2]
var_population_mean = [np.mean((sample - mu)**2) for sample in samples]          # E[(X - μ)^2]

# 棒グラフの準備
x = np.arange(1, num_simulations + 1)  # シミュレーション番号

plt.figure(figsize=(12, 6))

# 棒グラフをプロット
plt.bar(x - 0.2, var_sample_mean, width=0.4, label=r"$E[(X - \overline{X})^2]$", color='blue', alpha=0.7)
plt.bar(x + 0.2, var_population_mean, width=0.4, label=r"$E[(X - \mu)^2]$", color='orange', alpha=0.7)

# グラフ
plt.title(r"$E[(X - \overline{X})^2]$ と $E[(X - \mu)^2]$ の比較")
plt.xlabel("シミュレーション番号")
plt.ylabel("値")
plt.xticks(x)  # シミュレーション番号をx軸に設定
plt.legend()
plt.grid(axis='y')

# 表示
plt.tight_layout()
plt.show()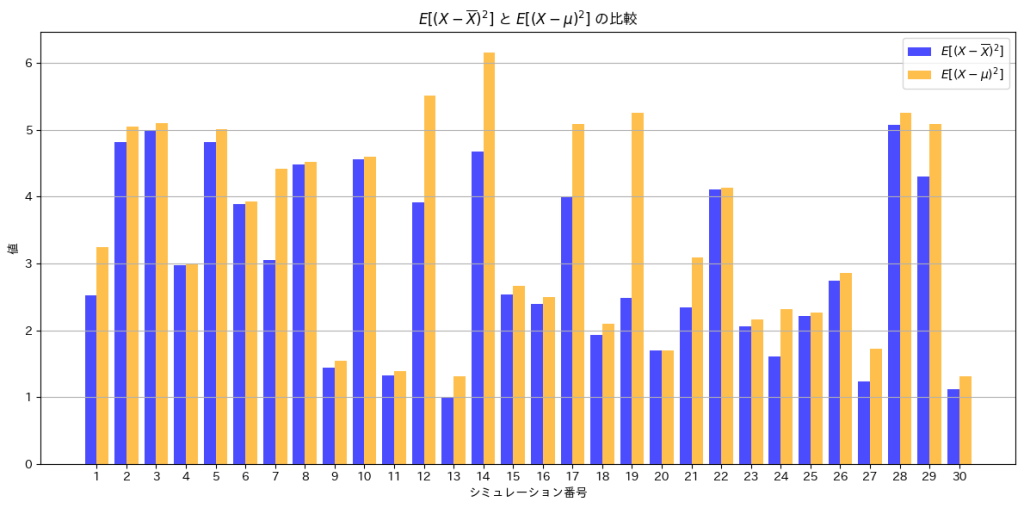
![]() は、
は、![]() よりも小さくなっていることが分かります。不偏分散
よりも小さくなっていることが分かります。不偏分散![]() は、nでなくn-1で割ることで、母分散の推定値として偏りを修正しています。
は、nでなくn-1で割ることで、母分散の推定値として偏りを修正しています。
2016 Q1(4)
正規分布の母平均μに対してθ=exp(μ)をパラメータとする尤度関数からフィッシャー情報量を求め、その逆数が不偏推定量の分散と一致するか否かを確かめた。
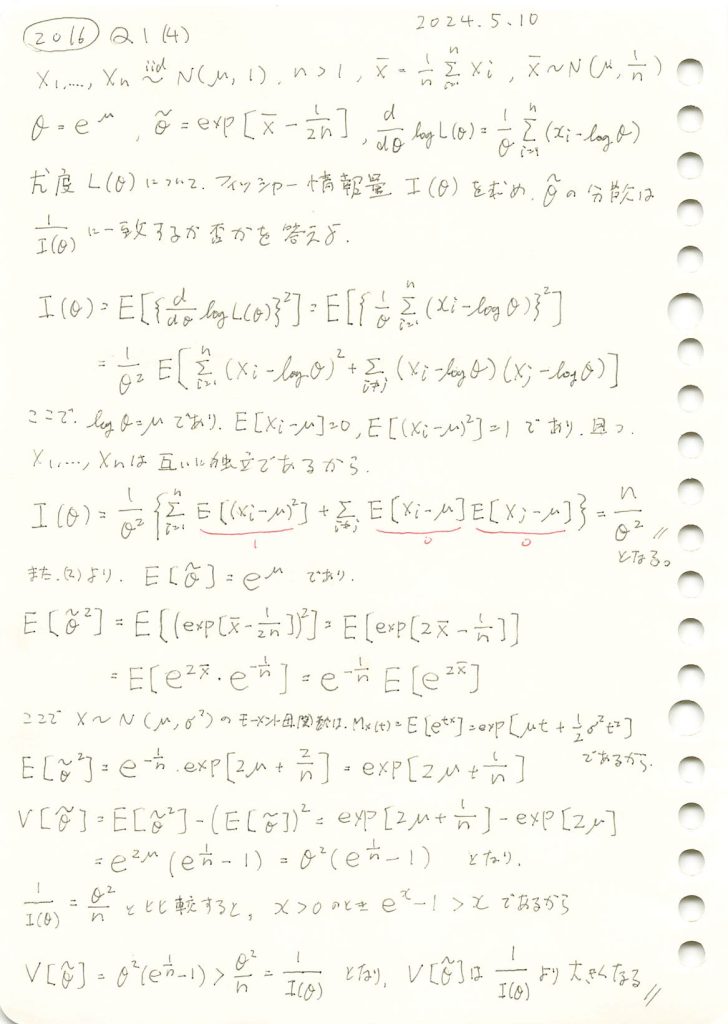
コード
![]() となることを確認するために、両辺をグラフで比較してみます。
となることを確認するために、両辺をグラフで比較してみます。
# 2016 Q1(4)  2024.11.14

import numpy as np
import matplotlib.pyplot as plt

# θ の範囲設定
theta_values = np.linspace(0.1, 5.0, 10)  # 0.1から5.0までの範囲で計算
n_samples = 50  # サンプルサイズ

# 分散 V[θ~] と 1/I(θ) の計算
V_theta_tilde = theta_values**2 * (np.exp(1 / n_samples) - 1)
Fisher_info_inverse = theta_values**2 / n_samples  # 1 / I(θ)

# 折れ線グラフの描画
plt.figure(figsize=(10, 6))
plt.plot(theta_values, V_theta_tilde, label=r'$V[\tilde{\theta}]$ (不偏推定量の分散)', color='blue', linestyle='-', marker='o')
plt.plot(theta_values, Fisher_info_inverse, label=r'$1/I(\theta)$ (フィッシャー情報量の逆数)', color='red', linestyle='--', marker='s')
plt.title('不偏推定量の分散とフィッシャー情報量の逆数の比較', fontsize=16)
plt.xlabel(r'$\theta$', fontsize=14)
plt.ylabel('分散', fontsize=14)
plt.legend(fontsize=12)
plt.grid(True, linestyle='--', alpha=0.7)
plt.show()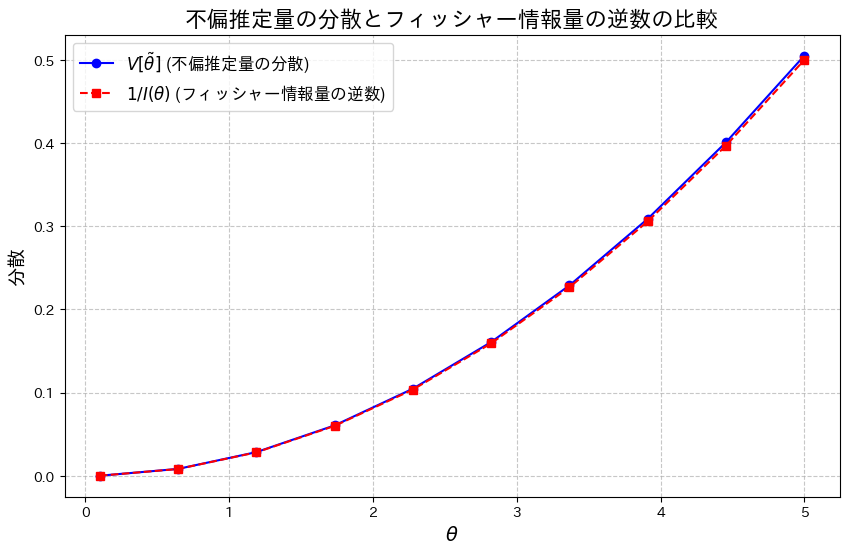
わずかに![]() となっているようです。
となっているようです。
次に、2式の差![]() をプロットし、その差を確認してみます。
をプロットし、その差を確認してみます。
# 2016 Q1(4)  2024.11.14

import numpy as np
import matplotlib.pyplot as plt

# θ の範囲設定
theta_values = np.linspace(0.1, 5.0, 10)  # 0.1から5.0までの範囲で計算
n_samples = 50  # サンプルサイズ

# 分散 V[θ~] と 1/I(θ) の計算
V_theta_tilde = theta_values**2 * (np.exp(1 / n_samples) - 1)
Fisher_info_inverse = theta_values**2 / n_samples  # 1 / I(θ)

# V[θ~] - 1/I(θ) を計算
diff_V_Fisher = V_theta_tilde - Fisher_info_inverse

# 差分をプロット
plt.figure(figsize=(10, 6))
plt.plot(theta_values, diff_V_Fisher, color='purple', linestyle='-', marker='o', label=r'$V[\tilde{\theta}] - \frac{1}{I(\theta)}$')
plt.title('不偏推定量の分散とフィッシャー情報量逆数の差', fontsize=16)
plt.xlabel(r'$\theta$', fontsize=14)
plt.ylabel(r'$V[\tilde{\theta}] - \frac{1}{I(\theta)}$', fontsize=14)
plt.axhline(0, color='black', linestyle='--', linewidth=1)  # y=0 の線を追加
plt.legend(fontsize=12)
plt.grid(True, linestyle='--', alpha=0.7)
plt.show()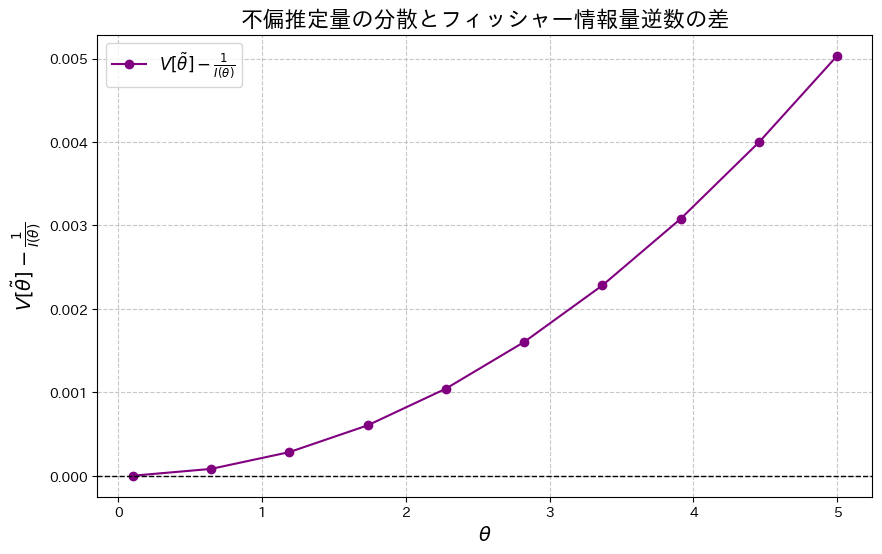
2式の差![]() が存在することが確認できました。この差は、θが増加するにつれて大きくなる傾向が見られます。
が存在することが確認できました。この差は、θが増加するにつれて大きくなる傾向が見られます。
次に、乱数を用いたシミュレーションを行い、![]() を重ねてプロットしてみます。
を重ねてプロットしてみます。
# 2016 Q1(4)  2024.11.14

import numpy as np
import matplotlib.pyplot as plt

# 再定義:thetaの範囲
theta_values = np.linspace(0.1, 5.0, 100)
n_samples = 50
n_trials = 10000  # シミュレーション試行回数

# 理論分散 V[θ~] と 1/I(θ) の計算
V_theta_tilde = theta_values**2 * (np.exp(1 / n_samples) - 1)
Fisher_info_inverse = theta_values**2 / n_samples

# シミュレーションによる分散の再計算
simulated_V_theta_tilde = []

for theta in theta_values:
    mse_trials = []

    for _ in range(n_trials):
        sample = np.random.normal(loc=np.log(theta), scale=1, size=n_samples)  # 平均 log(theta), 分散 1
        X_bar = np.mean(sample)
        theta_tilde = np.exp(X_bar - 1 / (2 * n_samples))  # 不偏推定量
        mse_trials.append((theta_tilde - theta)**2)  # 二乗誤差

    simulated_var = np.mean(mse_trials)  # シミュレーションによる分散 (MSE)
    simulated_V_theta_tilde.append(simulated_var)

# グラフの描画
plt.figure(figsize=(10, 6))
plt.plot(theta_values, V_theta_tilde, label='理論分散 $V[\\tilde{\\theta}]$', linestyle='-', color='blue', alpha=0.7)
plt.scatter(theta_values, simulated_V_theta_tilde, label='シミュレーション分散 $V[\\tilde{\\theta}]$', marker='s', color='red', alpha=0.6)
plt.plot(theta_values, Fisher_info_inverse, label='$1/I(\\theta)$ (フィッシャー情報量の逆数)', linestyle='--', color='green', alpha=0.8)
plt.title('不偏推定量の分散とフィッシャー情報量の逆数の比較', fontsize=16)
plt.xlabel('$\\theta$', fontsize=14)
plt.ylabel('分散', fontsize=14)
plt.legend(fontsize=12)
plt.grid(True, linestyle='--', alpha=0.7)
plt.show()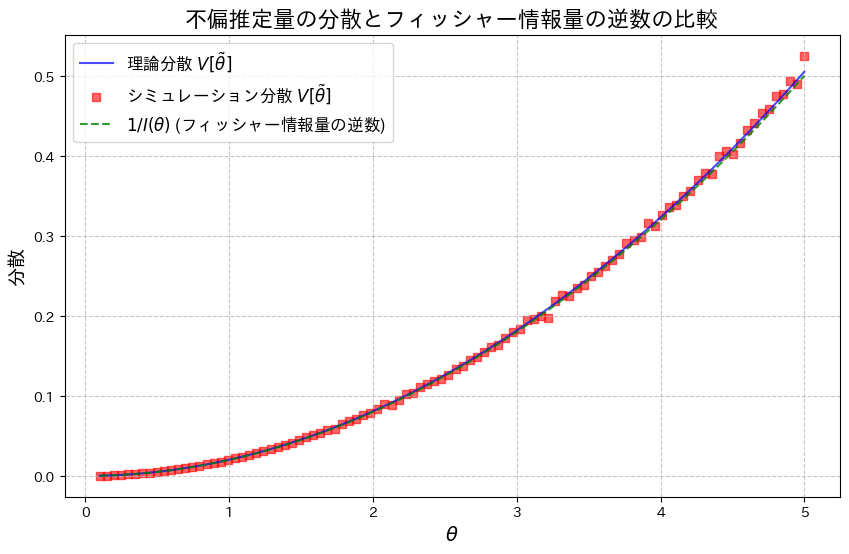
![]() は、わずかに
は、わずかに![]() を下回る場合があるようです。これは、シミュレーションにおける乱数の誤差によるものだと考えられます。
を下回る場合があるようです。これは、シミュレーションにおける乱数の誤差によるものだと考えられます。
2016 Q1(2)
正規分布の母平均μに対してθ=exp(μ)をパラメータとする最尤推定量のバイアスを調べて、与式がθの不偏推定量であることを示しました。
コード
![]() と
と![]() が真のθに近づくか確認するため、シミュレーションを行います。まずはサンプルサイズn=5で試してみます。
が真のθに近づくか確認するため、シミュレーションを行います。まずはサンプルサイズn=5で試してみます。
# 2016 Q1(2)  2024.11.12

import numpy as np
import matplotlib.pyplot as plt

# シミュレーションのパラメータ
mu_true = 1.0  # 真の平均 (mu)
theta_true = np.exp(mu_true)  # 真の θ = e^mu
n_samples = 5  # サンプルサイズ
n_trials = 100000  # シミュレーション試行回数

# 乱数生成と推定量の計算
theta_hat_estimates = []
theta_tilde_estimates = []

for _ in range(n_trials):
    sample = np.random.normal(loc=mu_true, scale=1/np.sqrt(n_samples), size=n_samples)
    X_bar = np.mean(sample)  # 標本平均

    # 最尤推定量 θ^
    theta_hat = np.exp(X_bar)
    theta_hat_estimates.append(theta_hat)

    # 不偏推定量 θ~
    theta_tilde = np.exp(X_bar - 1/(2*n_samples))
    theta_tilde_estimates.append(theta_tilde)

# 推定量の平均を計算
theta_hat_mean = np.mean(theta_hat_estimates)
theta_tilde_mean = np.mean(theta_tilde_estimates)

# グラフ描画
plt.figure(figsize=(12, 6))

# ヒストグラムの描画
plt.hist(theta_hat_estimates, bins=100, density=True, alpha=0.6, color='blue', label='$\\hat{\\theta}$ (最尤推定量)')
plt.hist(theta_tilde_estimates, bins=100, density=True, alpha=0.6, color='green', label='$\\tilde{\\theta}$ (不偏推定量)')

# 真の値を赤線で表示
plt.axvline(theta_true, color='red', linestyle='dashed', linewidth=2, label=f'真の$\\theta$: {theta_true:.2f}')

# θハットとθチルダの平均をそれぞれ緑線と青線で表示
plt.axvline(theta_hat_mean, color='blue', linestyle='dotted', linewidth=2, label=f'$\\hat{{\\theta}}$平均: {theta_hat_mean:.2f}')
plt.axvline(theta_tilde_mean, color='green', linestyle='dotted', linewidth=2, label=f'$\\tilde{{\\theta}}$平均: {theta_tilde_mean:.2f}')

# グラフのタイトルとラベル
plt.title('$\\hat{\\theta}$ と $\\tilde{\\theta}$ の分布', fontsize=16)
plt.xlabel('$\\theta$', fontsize=14)
plt.ylabel('密度', fontsize=14)
plt.legend(fontsize=12)
plt.grid(True)
plt.show()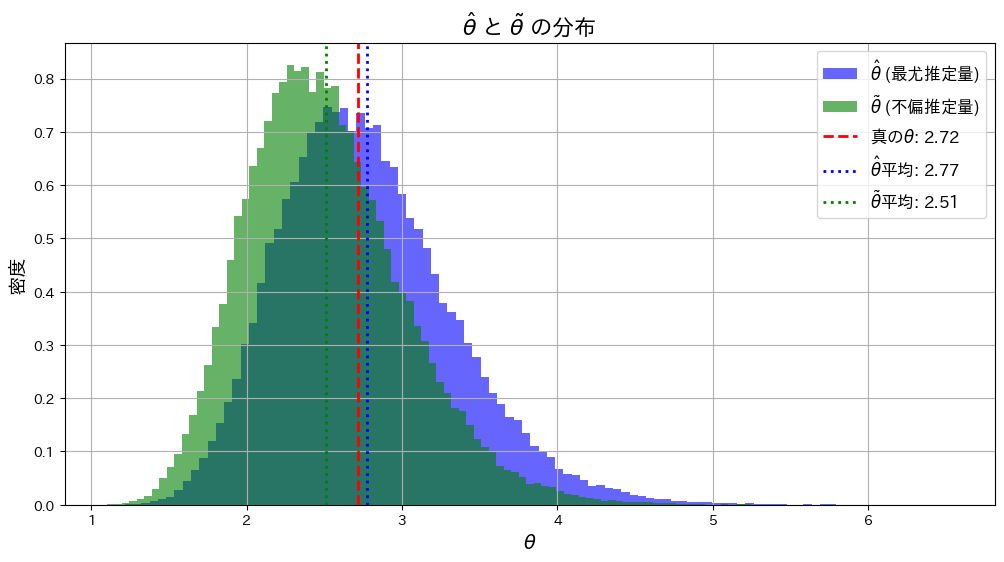
![]() は
は![]() よりも真のθに近くなっています。これはサンプルサイズnが小さいことと、および推定量の分散の違いが起因しているのかもしれません。
よりも真のθに近くなっています。これはサンプルサイズnが小さいことと、および推定量の分散の違いが起因しているのかもしれません。
次に、サンプルサイズn=5, 10, 20, 50と変化させて、この乖離がどのように変わるかを確認します。
# 2016 Q1(2)  2024.11.12

import numpy as np
import matplotlib.pyplot as plt

# シミュレーションのパラメータ
mu_true = 1.0  # 真の平均 (mu)
theta_true = np.exp(mu_true)  # 真の theta = e^mu
n_trials = 100000  # シミュレーション試行回数
sample_sizes = [5, 10, 20, 50]  # サンプルサイズのリスト

fig, axes = plt.subplots(2, 2, figsize=(12, 10))
axes = axes.ravel()  # 2x2 の配列を平坦化

for i, n_samples in enumerate(sample_sizes):
    theta_hat_estimates = []
    theta_tilde_estimates = []

    for _ in range(n_trials):
        sample = np.random.normal(loc=mu_true, scale=1/np.sqrt(n_samples), size=n_samples)
        X_bar = np.mean(sample)

        # 最尤推定量
        theta_hat = np.exp(X_bar)
        theta_hat_estimates.append(theta_hat)

        # 不偏推定量
        theta_tilde = np.exp(X_bar - 1/(2*n_samples))
        theta_tilde_estimates.append(theta_tilde)

    theta_hat_mean = np.mean(theta_hat_estimates)
    theta_tilde_mean = np.mean(theta_tilde_estimates)

    # ヒストグラムのプロット
    axes[i].hist(theta_hat_estimates, bins=100, density=True, alpha=0.6, color='blue', label='$\\hat{\\theta}$ (最尤推定量)')
    axes[i].hist(theta_tilde_estimates, bins=100, density=True, alpha=0.6, color='green', label='$\\tilde{\\theta}$ (不偏推定量)')
    axes[i].axvline(theta_true, color='red', linestyle='dashed', linewidth=2, label=f'真の$\\theta$: {theta_true:.2f}')
    axes[i].axvline(theta_hat_mean, color='blue', linestyle='dotted', linewidth=2, label=f'$\\hat{{\\theta}}$平均: {theta_hat_mean:.2f}')
    axes[i].axvline(theta_tilde_mean, color='green', linestyle='dotted', linewidth=2, label=f'$\\tilde{{\\theta}}$平均: {theta_tilde_mean:.2f}')
    axes[i].set_title(f'サンプルサイズ n={n_samples}')
    axes[i].set_xlabel('$\\theta$')
    axes[i].set_ylabel('密度')
    axes[i].legend()
    axes[i].grid(True)

plt.suptitle('$\\hat{\\theta}$ と $\\tilde{\\theta}$ の分布', fontsize=16)
plt.tight_layout(rect=[0, 0, 1, 0.95])
plt.show()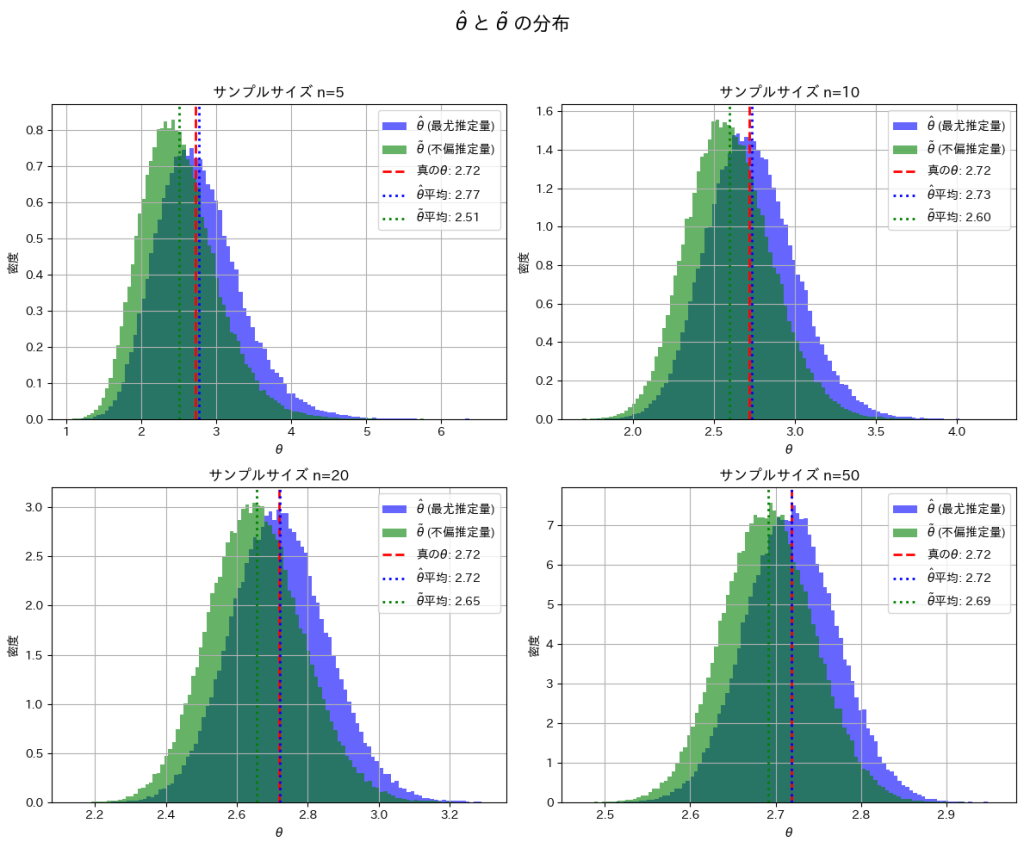
nを大きくすることで、![]() と
と![]() は真のθの間の乖離が小さくなることを確認できました。
は真のθの間の乖離が小さくなることを確認できました。
次に、nを変化させて![]() と
と![]() がどのように変化するか折れ線グラフで見てみます。
がどのように変化するか折れ線グラフで見てみます。
# 2016 Q1(2)  2024.11.12

import numpy as np
import matplotlib.pyplot as plt

# シミュレーションのパラメータ
mu_true = 1.0  # 真の平均 (mu)
theta_true = np.exp(mu_true)  # 真の theta = e^mu
n_trials = 100000  # シミュレーション試行回数
sample_sizes = np.arange(5, 101, 5)  # サンプルサイズ n の範囲 [5, 10, ..., 100]

# 推定量の平均値を格納するリスト
theta_hat_means = []
theta_tilde_means = []

# サンプルサイズを変化させてシミュレーション
for n_samples in sample_sizes:
    theta_hat_estimates = []
    theta_tilde_estimates = []

    for _ in range(n_trials):
        sample = np.random.normal(loc=mu_true, scale=1/np.sqrt(n_samples), size=n_samples)
        X_bar = np.mean(sample)

        # 最尤推定量
        theta_hat = np.exp(X_bar)
        theta_hat_estimates.append(theta_hat)

        # 不偏推定量
        theta_tilde = np.exp(X_bar - 1/(2*n_samples))
        theta_tilde_estimates.append(theta_tilde)

    # 平均値を格納
    theta_hat_means.append(np.mean(theta_hat_estimates))
    theta_tilde_means.append(np.mean(theta_tilde_estimates))

# 折れ線グラフの描画
plt.figure(figsize=(10, 6))
plt.plot(sample_sizes, theta_hat_means, marker='o', linestyle='-', color='blue', label='$\\hat{\\theta}$ (最尤推定量)')
plt.plot(sample_sizes, theta_tilde_means, marker='s', linestyle='-', color='green', label='$\\tilde{\\theta}$ (不偏推定量)')
plt.axhline(y=theta_true, color='red', linestyle='dashed', linewidth=2, label=f'真の$\\theta$: {theta_true:.2f}')

# ラベルとタイトル
plt.title('サンプルサイズ n に対する $\\hat{\\theta}$ と $\\tilde{\\theta}$ の平均値', fontsize=16)
plt.xlabel('サンプルサイズ $n$', fontsize=14)
plt.ylabel('$\\theta$の平均値', fontsize=14)
plt.legend(fontsize=12)
plt.grid(True)
plt.show()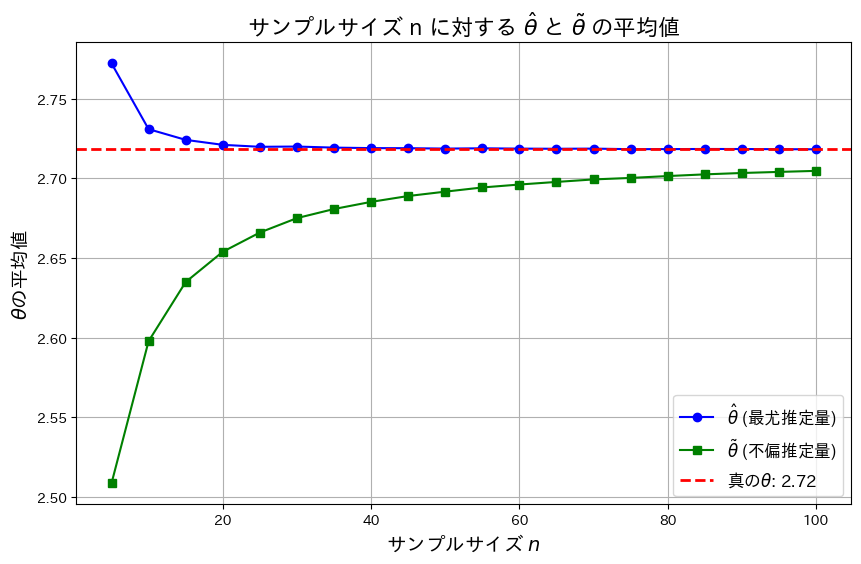
![]() は真のθよりも大きい値を取り、徐々に減少し真のθに近づきます。一方
は真のθよりも大きい値を取り、徐々に減少し真のθに近づきます。一方![]() 真のθよりも小さい値を取り、徐々に増加し真のθに近づきます。また近づくスピードは
真のθよりも小さい値を取り、徐々に増加し真のθに近づきます。また近づくスピードは![]() のほうが早く、
のほうが早く、![]() の分散が
の分散が![]() の分散よりも小さいことが分かります。
の分散よりも小さいことが分かります。
2017 Q2(4)
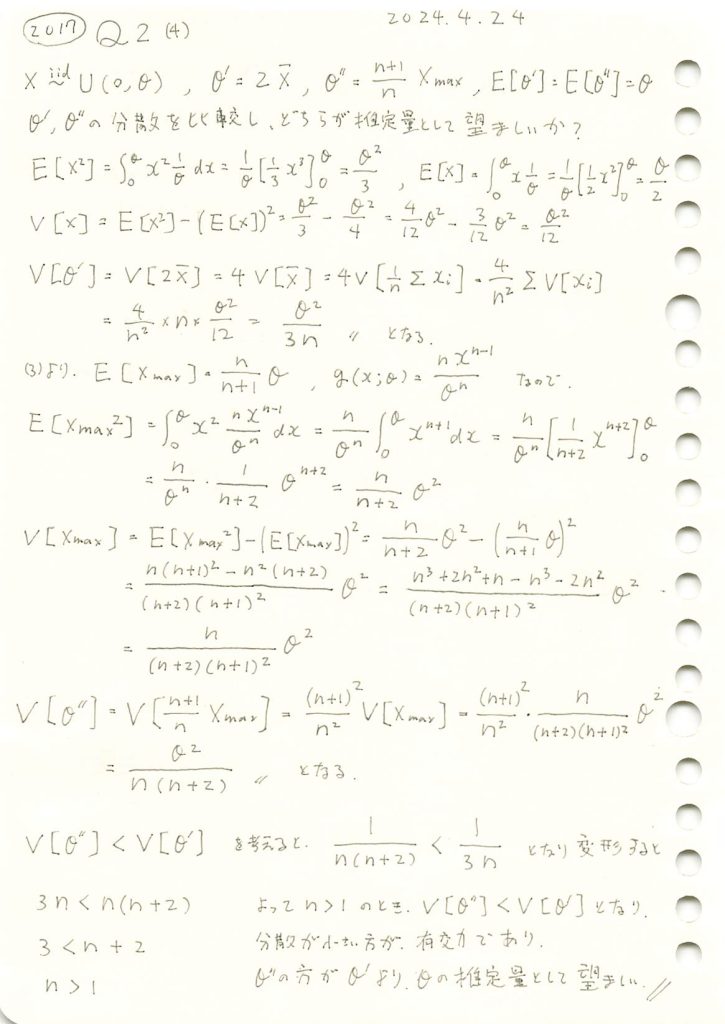
二つの不偏推定量の分散の大きさを比較する事でどちらの推定量が望ましいかを調べました。
コード
θ=10,n=20としてシミュレーションを行い、θ’とθ’’の分布を重ねて描画してみます。
# 2017 Q2(4)  2024.11.1

import numpy as np
import matplotlib.pyplot as plt

# パラメータ設定
theta_true = 10  # 真の θ の値
n = 20           # サンプルサイズ
num_trials = 1000  # シミュレーションの試行回数

# θ' = 2 * X̄ と θ'' = (n + 1) / n * X_max の推定値を記録するリスト
theta_prime_estimates = []
theta_double_prime_estimates = []

# シミュレーションを実行
for _ in range(num_trials):
    # 一様分布 U(0, theta_true) から n 個のサンプルを生成
    samples = np.random.uniform(0, theta_true, n)

    # θ' = 2 * X̄ を計算
    theta_prime = 2 * np.mean(samples)
    theta_prime_estimates.append(theta_prime)

    # θ'' = (n + 1) / n * X_max を計算
    theta_double_prime = (n + 1) / n * np.max(samples)
    theta_double_prime_estimates.append(theta_double_prime)

# ヒストグラムの表示
plt.hist(theta_prime_estimates, bins=30, edgecolor='black', density=True, alpha=0.5, label=r'$\theta\' = 2 \bar{X}$')
plt.hist(theta_double_prime_estimates, bins=30, edgecolor='black', density=True, alpha=0.5, label=r'$\theta\'\' = \frac{n + 1}{n} X_{\max}$')
plt.axvline(theta_true, color='red', linestyle='dashed', linewidth=1, label=f"真の θ = {theta_true}")
plt.xlabel('推定量')
plt.ylabel('密度')
plt.title(r'$\theta\' = 2 \bar{X}$ と $\theta\'\' = \frac{n + 1}{n} X_{\max}$ の分布')
plt.legend()
plt.show()
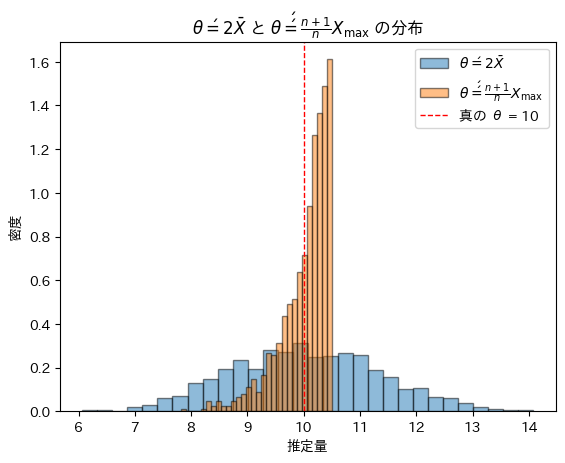
θ’とθ’’は同じ期待(θ)を持つものの横の広がり方が異なりθ’’の分散はθ’の分散よりも小さいことが確認できました。
次にサンプルサイズnを変化させて不偏推定量θ’とθ’’を重ねて描画してみます。
# 2017 Q2(4)  2024.11.1

import numpy as np
import matplotlib.pyplot as plt

# パラメータ設定
theta_true = 10  # 真の θ の値
max_n = 100      # 最大サンプルサイズ
num_trials_per_n = 100  # 各サンプルサイズでの試行回数

# 各サンプルサイズにおける θ' と θ'' の平均を記録
theta_prime_means = []
theta_double_prime_means = []

# サンプルサイズ n を 1 から max_n まで増やしながらシミュレーション
for n in range(1, max_n + 1):
    theta_prime_estimates = []
    theta_double_prime_estimates = []

    for _ in range(num_trials_per_n):
        # 一様分布 U(0, theta_true) から n 個のサンプルを生成
        samples = np.random.uniform(0, theta_true, n)

        # θ' = 2 * X̄ を計算し、その推定値を記録
        theta_prime = 2 * np.mean(samples)
        theta_prime_estimates.append(theta_prime)

        # θ'' = (n + 1) / n * X_max を計算し、その推定値を記録
        theta_double_prime = (n + 1) / n * np.max(samples)
        theta_double_prime_estimates.append(theta_double_prime)

    # 各 n に対する θ' と θ'' の平均を保存
    theta_prime_means.append(np.mean(theta_prime_estimates))
    theta_double_prime_means.append(np.mean(theta_double_prime_estimates))

# グラフ描画
plt.plot(range(1, max_n + 1), theta_prime_means, label=r'$\mathbb{E}[\theta\']$', color='orange', alpha=0.7)
plt.plot(range(1, max_n + 1), theta_double_prime_means, label=r'$\mathbb{E}[\theta\'\']$', color='saddlebrown', alpha=0.7)
plt.axhline(theta_true, color='red', linestyle='dashed', linewidth=1, label=f"真の θ = {theta_true}")
plt.xlabel(r'サンプルサイズ $n$')
plt.ylabel('推定量の平均')
plt.title(r'サンプルサイズ $n$ と 推定量 $\theta\' = 2 \bar{X}$, $\theta\'\' = \frac{n + 1}{n} X_{\max}$ の関係')
plt.legend()
plt.show()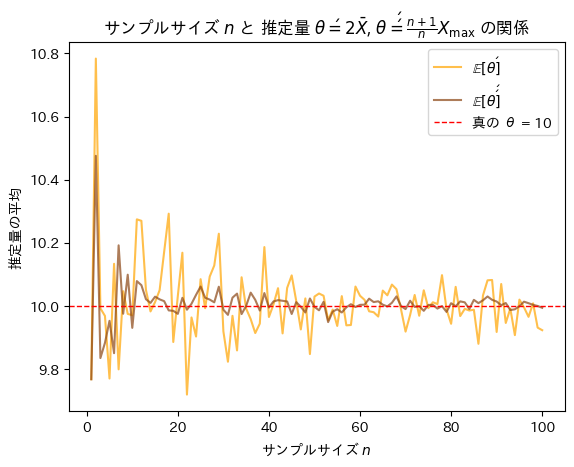
サンプルサイズnが増加するにつれて不偏推定量θ’とθ’’は共に真のθに近づくものの振幅が異なりθ’’の分散はθ’の分散よりも小さいことが確認できました。また収束する速度もθ’’はθ’よりも速いことが確認できました。
2017 Q2(3)
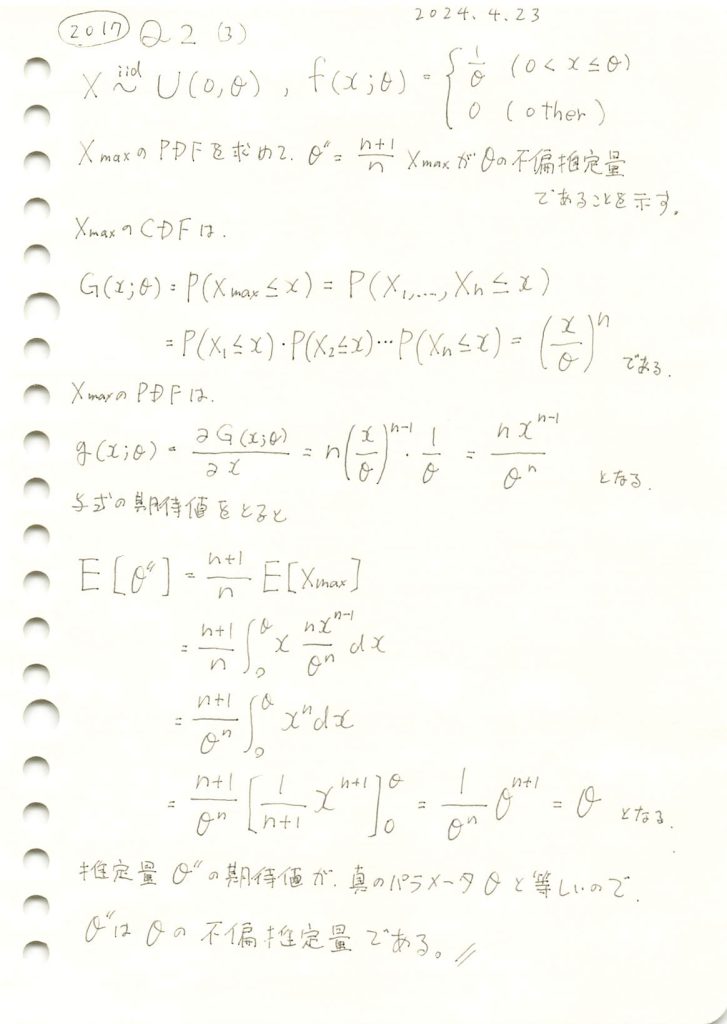
サンプルデータの最大値の(n+1)/n倍が一様分布の上限値の不偏推定量であることの証明をしました。
コード
θ=10,n=20としてシミュレーションを行い、θ’’の分布を見てみます。
# 2017 Q2(3)  2024.10.31

import numpy as np
import matplotlib.pyplot as plt

# パラメータ設定
theta_true = 10  # 真の θ の値
n = 20           # サンプルサイズ
num_trials = 1000  # シミュレーションの試行回数

# シミュレーションを実行
theta_double_prime_estimates = []
for _ in range(num_trials):
    # 一様分布 U(0, theta_true) から n 個のサンプルを生成
    samples = np.random.uniform(0, theta_true, n)
    # サンプルの最大値 X_max を計算し、それを用いて θ'' を計算
    theta_double_prime = (n + 1) / n * np.max(samples)
    theta_double_prime_estimates.append(theta_double_prime)

# θ'' の分布をヒストグラムで表示
plt.hist(theta_double_prime_estimates, bins=30, edgecolor='black', density=True)
plt.axvline(theta_true, color='red', linestyle='dashed', linewidth=1, label=f"真の θ = {theta_true}")
plt.xlabel(r'$\theta\'\' = \frac{n + 1}{n} X_{\max}$')
plt.ylabel('密度')
plt.title(r'$\theta\'\' = \frac{n + 1}{n} X_{\max}$ の分布')
plt.legend()
plt.show()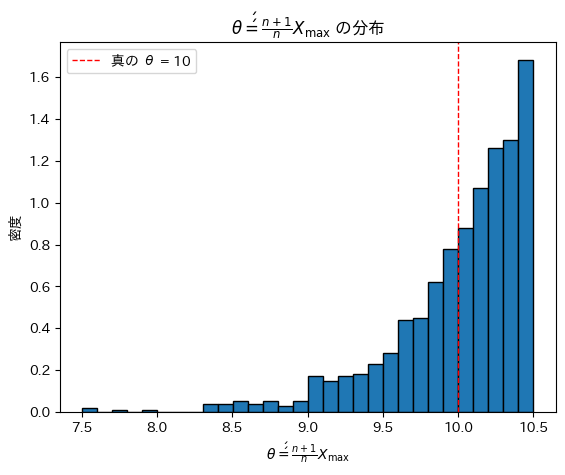
θ’’は、元となるXmaxの分布を右にずらした形状を取っています。期待値は真のθに一致しているようです。
次にサンプルサイズnを変化させて不偏推定量θ’’がどうなるのか確認をします。
# 2017 Q2(3)  2024.10.31

import numpy as np
import matplotlib.pyplot as plt

# パラメータ設定
theta_true = 10  # 真の θ の値
max_n = 100      # 最大サンプルサイズ
num_trials_per_n = 100  # 各サンプルサイズでの試行回数

# 各サンプルサイズにおける θ'' の平均を記録
theta_double_prime_means = []

# サンプルサイズ n を 1 から max_n まで増やしながらシミュレーション
for n in range(1, max_n + 1):
    theta_double_prime_estimates = []
    for _ in range(num_trials_per_n):
        # 一様分布 U(0, theta_true) から n 個のサンプルを生成
        samples = np.random.uniform(0, theta_true, n)
        # サンプルの最大値 X_max を計算し、それを用いて θ'' を計算
        theta_double_prime = (n + 1) / n * np.max(samples)
        theta_double_prime_estimates.append(theta_double_prime)
    # 各 n に対する θ'' の平均を保存
    theta_double_prime_means.append(np.mean(theta_double_prime_estimates))

# グラフ描画
plt.plot(range(1, max_n + 1), theta_double_prime_means, label=r'$\mathbb{E}[\theta\'\']$')
plt.axhline(theta_true, color='red', linestyle='dashed', linewidth=1, label=f"真の θ = {theta_true}")
plt.xlabel(r'サンプルサイズ $n$')
plt.ylabel(r'推定量 $\theta\'\' = \frac{n + 1}{n} X_{\max}$ の平均')
plt.title(r'サンプルサイズ $n$ と $\theta\'\' = \frac{n + 1}{n} X_{\max}$ の関係')
plt.legend()
plt.show()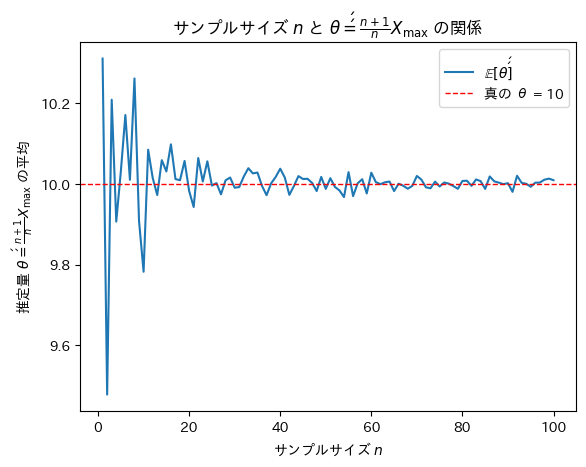
サンプルサイズnが増加するにつれて不偏推定量θ’’は真のθに近づくことが確認できました。
2017 Q2(2)
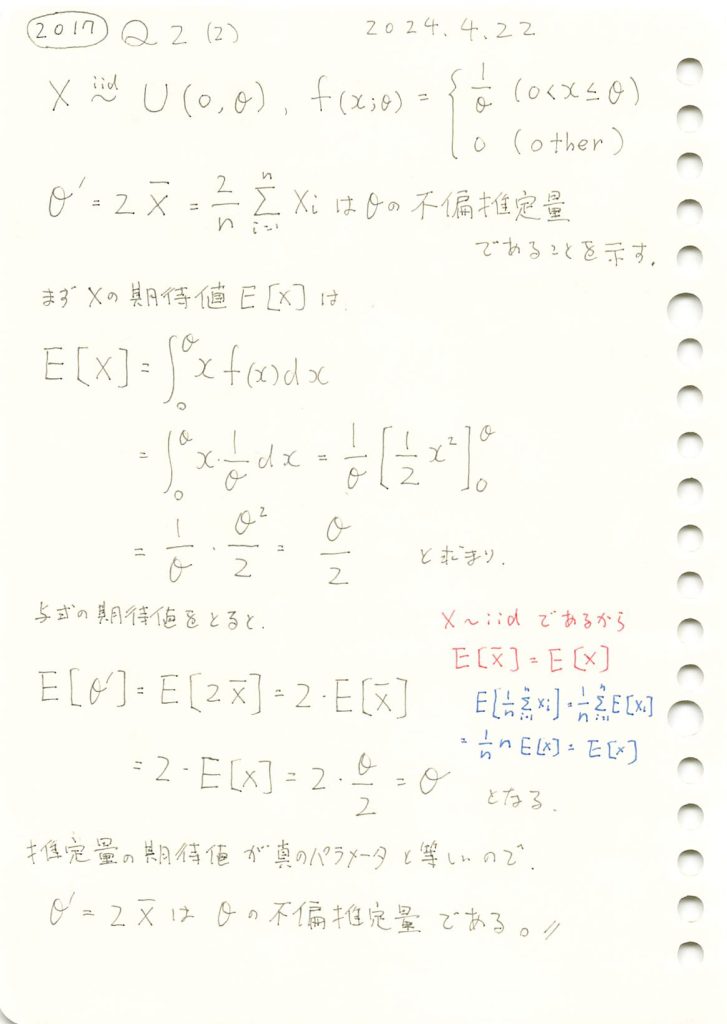
標本平均の2倍が一様分布の上限値の不偏推定量であることの証明をしました。
コード
θ=10,n=20としてシミュレーションを行い、θ’の分布を見てみます。
# 2017 Q2(2)  2024.10.30

import numpy as np
import matplotlib.pyplot as plt

# シミュレーションのパラメータ
theta_true = 10  # 真の θ の値
n = 20           # 1試行あたりのサンプル数
num_trials = 1000  # シミュレーションの試行回数

# シミュレーションを実行
theta_prime_estimates = []
for _ in range(num_trials):
    # 一様分布 U(0, theta_true) から n 個のサンプルを生成
    samples = np.random.uniform(0, theta_true, n)
    # サンプル平均 X̄ を計算し、それを用いて θ' を計算
    theta_prime = 2 * np.mean(samples)
    theta_prime_estimates.append(theta_prime)

# θ' の分布をヒストグラムで表示
plt.hist(theta_prime_estimates, bins=30, edgecolor='black', density=True)
plt.axvline(theta_true, color='red', linestyle='dashed', linewidth=1, label=f"真の θ = {theta_true}")
plt.xlabel(r'$\theta\' = 2\bar{X}$')
plt.ylabel('密度')
plt.title(r'$\theta\' = 2\bar{X}$ の分布')
plt.legend()
plt.show()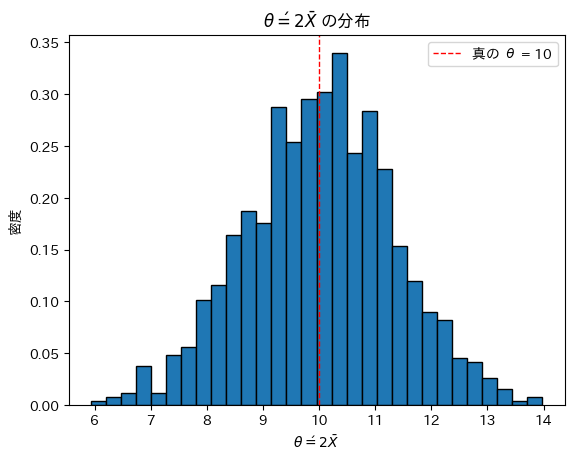
θ’は真のθを中心に左右対称にバラついています。θ’は不偏であるように見えます。
次にサンプルサイズnを変化させて不偏推定量θ’がどうなるのか確認をします。
# 2017 Q2(2)  2024.10.30

import numpy as np
import matplotlib.pyplot as plt

# パラメータ設定
theta_true = 10  # 真の θ の値
max_n = 100      # 最大サンプルサイズ
num_trials_per_n = 100  # 各サンプルサイズでの試行回数

# 各サンプルサイズにおける θ' の平均を記録
theta_prime_means = []

# サンプルサイズ n を 1 から max_n まで増やしながらシミュレーション
for n in range(1, max_n + 1):
    theta_prime_estimates = []
    for _ in range(num_trials_per_n):
        # 一様分布 U(0, theta_true) から n 個のサンプルを生成
        samples = np.random.uniform(0, theta_true, n)
        # サンプル平均 X̄ を計算し、それを用いて θ' を計算
        theta_prime = 2 * np.mean(samples)
        theta_prime_estimates.append(theta_prime)
    # 各 n に対する θ' の平均を保存
    theta_prime_means.append(np.mean(theta_prime_estimates))

# グラフ描画
plt.plot(range(1, max_n + 1), theta_prime_means, label=r'$\mathbb{E}[\theta\']$')
plt.axhline(theta_true, color='red', linestyle='dashed', linewidth=1, label=f"真の θ = {theta_true}")
plt.xlabel(r'サンプルサイズ $n$')
plt.ylabel(r'推定量 $\theta\' = 2 \bar{X}$ の平均')
plt.title(r'サンプルサイズ $n$ と $\theta\' = 2 \bar{X}$ の関係')
plt.legend()
plt.show()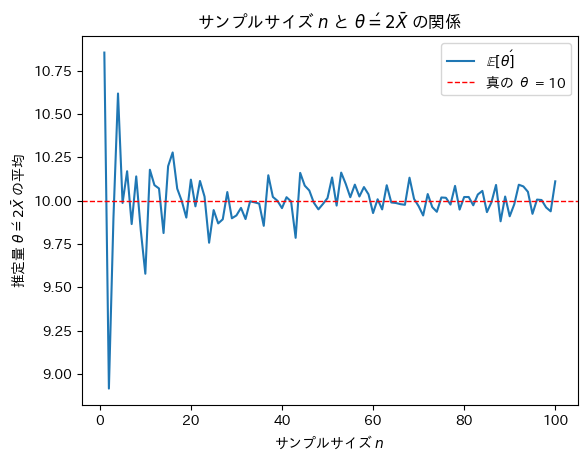
サンプルサイズnが増加するにつれて不偏推定量θ’は真のθに近づくことが確認できました。
2018 Q1(1)
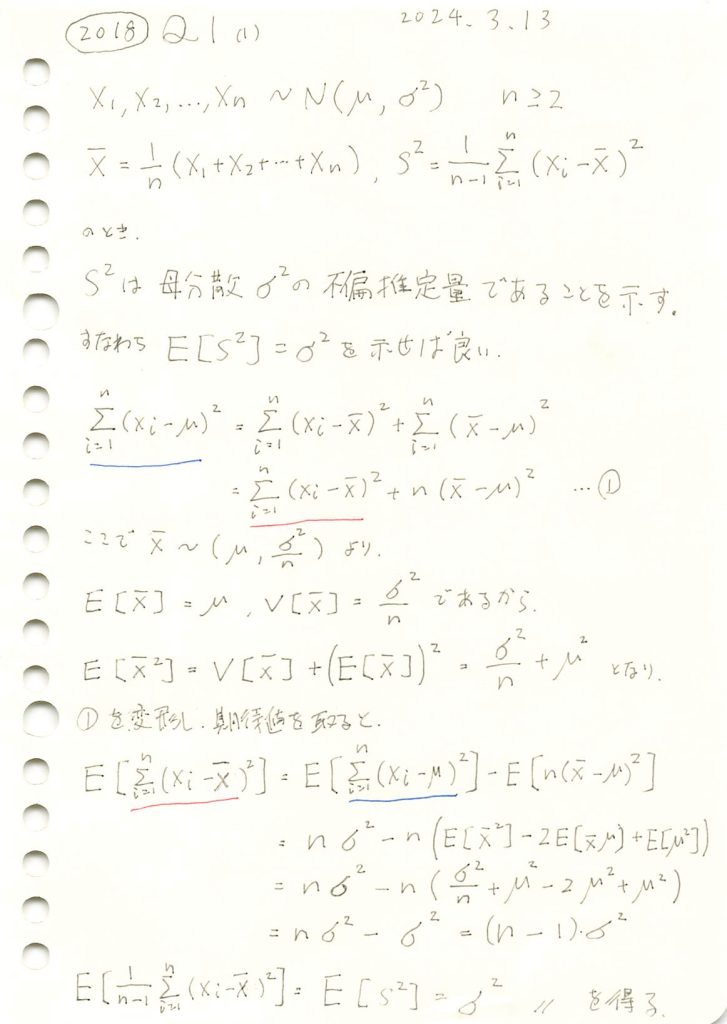
不偏分散が母分散の不偏推定量であることを示しました。
コード
nを2~100に変化させて、不偏分散と標本分散を比較してみます。
import numpy as np
import matplotlib.pyplot as plt

# パラメータ設定
mu = 0      # 母集団平均
sigma = 2   # 母集団標準偏差
sigma_squared = sigma ** 2  # 真の母分散
n_values = range(2, 101, 2)  # サンプルサイズ n を2から100まで2ステップで変化させる
num_trials = 3000  # 各 n に対して100回の試行を行う

# 不偏分散 (1/(n-1)) と 標本分散 (1/n) を計算するためのリスト
unbiased_variances = []
biased_variances = []

# 各サンプルサイズ n で分散を計算
for n in n_values:
    unbiased_variance_sum = 0
    biased_variance_sum = 0

    # 各サンプルサイズ n に対して複数回試行して平均を計算
    for _ in range(num_trials):
        # 正規分布に従うサンプルを生成
        sample = np.random.normal(mu, sigma, n)

        # 標本平均
        sample_mean = np.mean(sample)

        # 不偏分散 (1/(n-1))
        unbiased_variance = np.sum((sample - sample_mean) ** 2) / (n - 1)
        unbiased_variance_sum += unbiased_variance

        # 標本分散 (1/n)
        biased_variance = np.sum((sample - sample_mean) ** 2) / n
        biased_variance_sum += biased_variance

    # 各 n に対する平均分散をリストに追加
    unbiased_variances.append(unbiased_variance_sum / num_trials)
    biased_variances.append(biased_variance_sum / num_trials)

# グラフを描画
plt.plot(n_values, unbiased_variances, label="不偏分散 (1/(n-1))", color='blue', marker='o')
plt.plot(n_values, biased_variances, label="標本分散 (1/n)", color='red', linestyle='--', marker='x')

# 真の分散を水平線で描画
plt.axhline(y=sigma_squared, color='green', linestyle='-', label=f'真の分散 = {sigma_squared}')

# グラフの設定
plt.title('サンプルサイズに対する標本分散と不偏分散の比較')
plt.xlabel('サンプルサイズ n')
plt.ylabel('分散')
plt.legend()
plt.grid(True)
plt.show()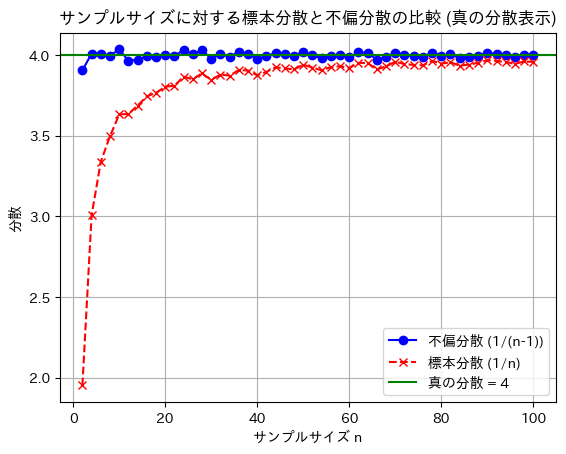
標本分散には不偏性はなく、不偏分散には不偏性があることが確認できました。
2019 Q3(4)
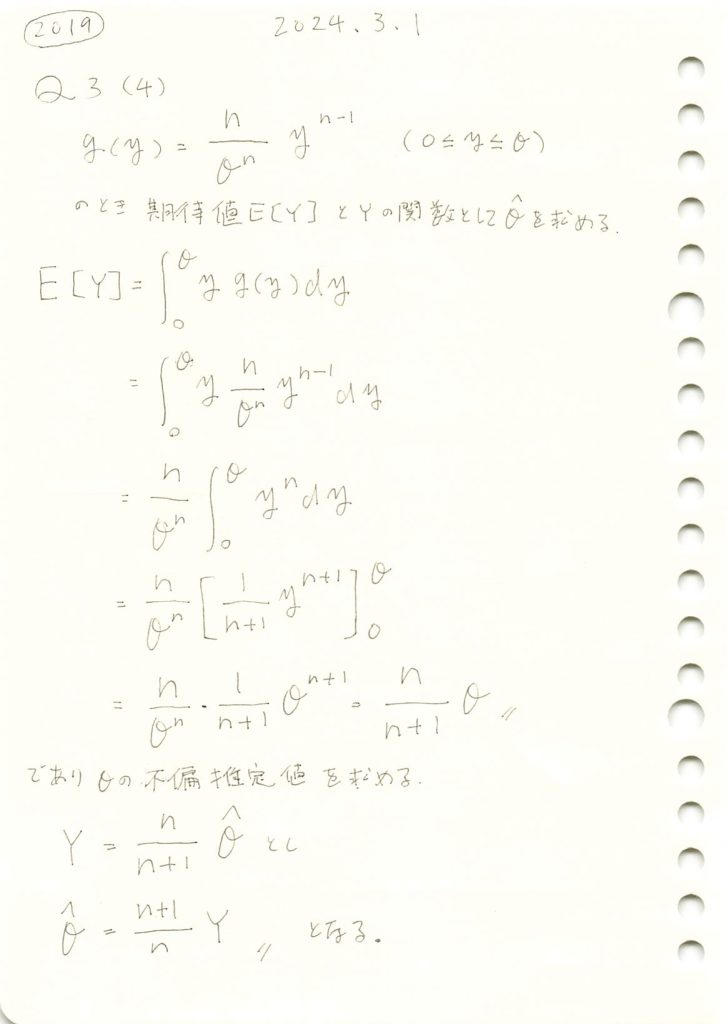
一様分布に従う複数の確率変数がとる最大値の期待値と、その最大値から上限θの不偏推定量を求めました。
コード
数式を使って期待値E(Y)とθの不偏推定量を求めます。
# 2019 Q3(4)  2024.9.20

import sympy as sp

# シンボリック変数の定義
y, theta, n = sp.symbols('y theta n', positive=True, real=True)

# 最大値Yの確率密度関数 f_Y(y)
f_Y = (n / theta**n) * y**(n-1)

# 期待値 E[Y] の定義
E_Y = sp.integrate(y * f_Y, (y, 0, theta))

# 期待値 E[Y] の表示
print(f"E[Y] の導出結果:")
display(sp.simplify(E_Y))

# 改行を追加
print()

# 新しいシンボリック変数Yの定義
Y = sp.symbols('Y', positive=True, real=True)

# 理論的な E[Y] の式(E[Y] = n/(n+1) * theta)
theoretical_E_Y = (n / (n + 1)) * theta

# Y を基にして theta を求める方程式を解く
theta_hat = sp.solve(Y - theoretical_E_Y, theta)[0]

# 不偏推定量の結果表示
print(f"不偏推定量 θ̂ の導出結果:")
display(theta_hat)
式の形は少し違いますが正しいですね。
次に、数値シミュレーションにより期待値E(Y)とθの不偏推定量求め理論値と比較します。
# 2019 Q3(4)  2024.9.20

import numpy as np
import matplotlib.pyplot as plt

# パラメータ設定
theta_true = 10  # 真のθ
n = 15  # サンプルサイズ
num_simulations = 10000  # シミュレーション回数

# シミュレーションでの最大値Yを格納するリスト
max_values = []

# シミュレーション開始
for _ in range(num_simulations):
    # U(0, theta_true) から n 個の乱数を生成
    samples = np.random.uniform(0, theta_true, n)

    # その中での最大値Yを記録
    max_values.append(np.max(samples))

# シミュレーションによる期待値E[Y]を計算
simulated_E_Y = np.mean(max_values)

# 理論値E[Y]を計算
theoretical_E_Y = (n / (n + 1)) * theta_true

# 不偏推定量のシミュレーション
theta_hat_simulated = (n + 1) / n * np.mean(max_values)

# 結果の表示
print(f"シミュレーションによる E[Y]: {simulated_E_Y}")
print(f"理論値 E[Y]: {theoretical_E_Y}")
print(f"シミュレーションによる不偏推定量 θ̂: {theta_hat_simulated}")
print(f"真の θ: {theta_true}")

# ヒストグラムを描画して結果を視覚化
plt.hist(max_values, bins=30, density=True, alpha=0.7, color='blue', edgecolor='black', label='シミュレーション結果')
plt.axvline(simulated_E_Y, color='red', linestyle='--', label=f'シミュレーション E[Y] = {simulated_E_Y:.2f}')
plt.axvline(theoretical_E_Y, color='green', linestyle='--', label=f'理論値 E[Y] = {theoretical_E_Y:.2f}')

# グラフ設定
plt.title('最大値Yの分布とE[Y]')
plt.xlabel('Y の値')
plt.ylabel('密度')
plt.legend()
plt.grid(True)
plt.show()
シミュレーションによる E[Y]: 9.384118720046189
理論値 E[Y]: 9.375
シミュレーションによる不偏推定量 θ̂: 10.009726634715935
真の θ: 10
期待値E(Y)とθの不偏推定量は理論値に近い値を取りました。