ホーム » 統計検定1級 2018年 統計数理 (ページ 3)
「統計検定1級 2018年 統計数理」カテゴリーアーカイブ
2018 Q1(4)-1
不偏分散の平方根の期待値に於いて、母標準偏差に対する偏りを求めました。
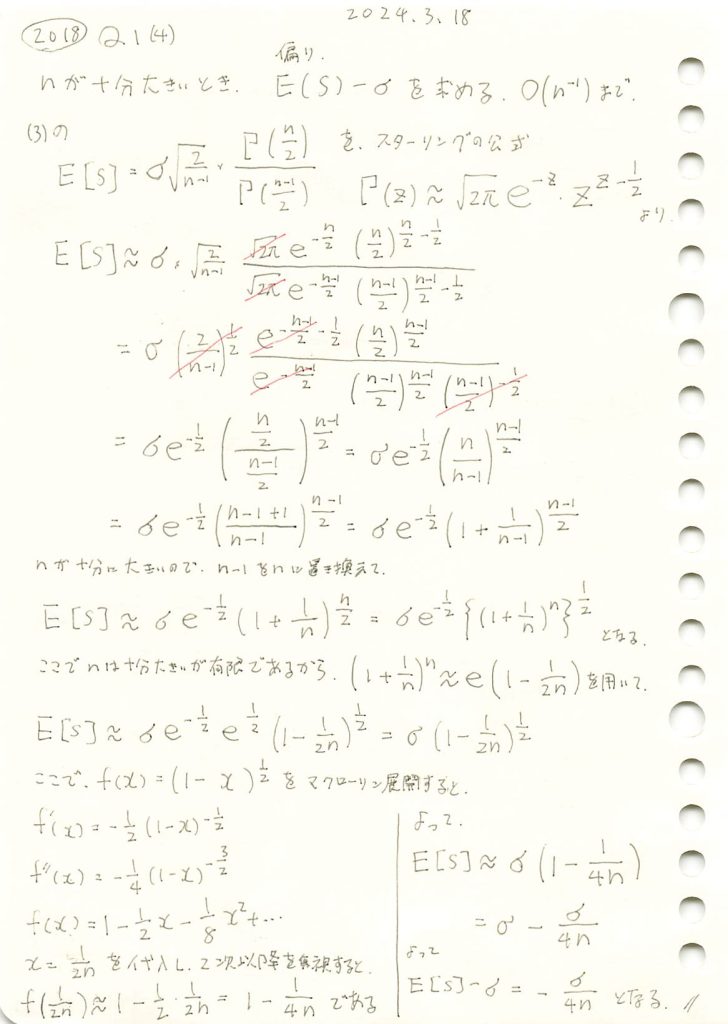
コード
数値シミュレーションでE[S] 求め、理論値![]() と一致するか確認します。
と一致するか確認します。
import numpy as np
import matplotlib.pyplot as plt

# パラメータ設定
sigma = 2  # 母標準偏差
n_values = np.array([10, 20, 50, 100, 200])  # サンプルサイズの値
num_simulations = 10000  # シミュレーションの回数

# 結果を格納するリスト
simulated_means = []
theoretical_means = []
sigma_values = [sigma] * len(n_values)  # 母標準偏差の値をリストで作成

# シミュレーション実行
for n in n_values:
    # カイ二乗分布に従う乱数を生成
    chi_squared_samples = np.random.chisquare(df=n-1, size=num_simulations)

    # 標本標準偏差 S のシミュレーション
    S_simulation = sigma * np.sqrt(chi_squared_samples / (n - 1))

    # シミュレーションの期待値 (平均)
    simulated_mean = np.mean(S_simulation)
    simulated_means.append(simulated_mean)

    # 理論値 E[S] = σ - σ / (4n)
    theoretical_mean = sigma - sigma / (4 * n)
    theoretical_means.append(theoretical_mean)

# 結果表示
for i, n in enumerate(n_values):
    print(f"n = {n}: シミュレーション平均 = {simulated_means[i]:.4f}, 理論値 = {theoretical_means[i]:.4f}, 母標準偏差 = {sigma:.4f}")

# グラフ描画
plt.figure(figsize=(8, 6))
plt.plot(n_values, simulated_means, 'bo-', label='シミュレーション平均')
plt.plot(n_values, theoretical_means, 'r--', label='理論値')
plt.plot(n_values, sigma_values, 'g-', label='母標準偏差 σ')
plt.xlabel('サンプルサイズ n')
plt.ylabel('期待値 E[S]')
plt.title('標本標準偏差 E[S] のシミュレーションと理論値の比較')
plt.legend()
plt.grid(True)
plt.show()
n = 10: シミュレーション平均 = 1.9394, 理論値 = 1.9500, 母標準偏差 = 2.0000
n = 20: シミュレーション平均 = 1.9747, 理論値 = 1.9750, 母標準偏差 = 2.0000
n = 50: シミュレーション平均 = 1.9888, 理論値 = 1.9900, 母標準偏差 = 2.0000
n = 100: シミュレーション平均 = 1.9961, 理論値 = 1.9950, 母標準偏差 = 2.0000
n = 200: シミュレーション平均 = 1.9974, 理論値 = 1.9975, 母標準偏差 = 2.0000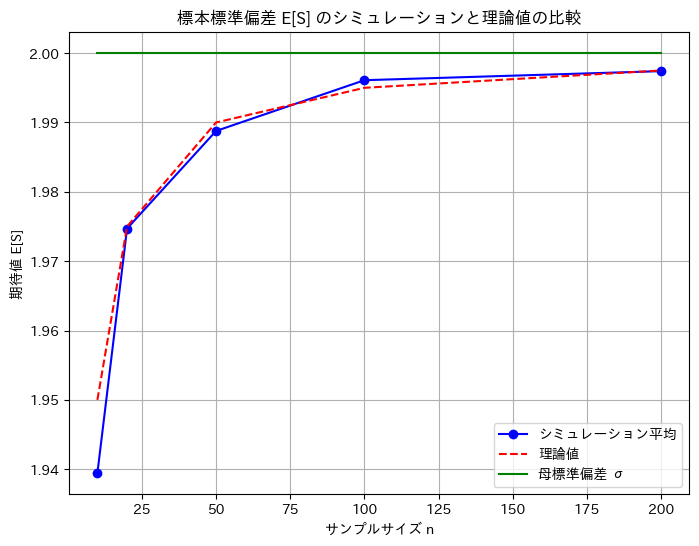
数値シミュレーションでのE[S]は、理論値![]() に一致することが確認できました。
に一致することが確認できました。
2018 Q1(3)
カイ二乗分布の平方根の期待値と標本標準偏差の期待値を求めました。不偏分散の期待値は母分散なのにその平方根の期待値は母標準偏差にはならないのが面白い。
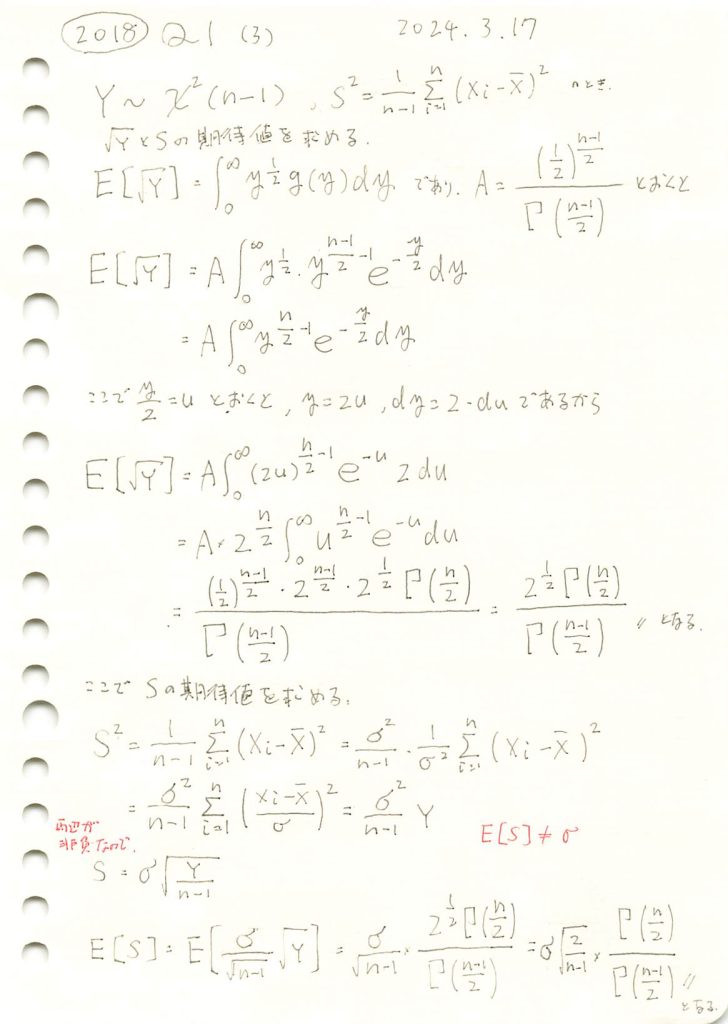
コード
数式を使って期待値E[√Y]とE[S]を求めます。
# 2018 Q1(3)  2024.10.3

import sympy as sp

# 変数の定義
y, n, sigma = sp.symbols('y n sigma', positive=True)
k = n - 1  # 自由度

# カイ二乗分布の確率密度関数 g(y)
g_y = (1/2)**(k/2) * y**(k/2 - 1) * sp.exp(-y/2) / sp.gamma(k/2)

# 平方根の期待値 E[√Y] の積分を計算
E_sqrt_Y = sp.integrate(sp.sqrt(y) * g_y, (y, 0, sp.oo))

# 標本標準偏差 S の期待値 E[S] を計算
E_S = sigma * E_sqrt_Y / sp.sqrt(n-1)

# 結果の表示
display(E_sqrt_Y.simplify())  # E[√Y] の表示
display(E_S.simplify())       # E[S] の表示
余分な1.0^nが含まれますが手計算と一致しました。
次に、期待値E[√Y]とE[S]を数値シミュレーションで求めてみます。
# 2018 Q1(3)  2024.10.3

import numpy as np
import matplotlib.pyplot as plt
from scipy.special import gamma

# パラメータ設定
n = 10  # サンプルサイズ (自由度は n-1)
degrees_of_freedom = n - 1  # 自由度
sigma = 2  # 母標準偏差
num_simulations = 10000  # シミュレーションの回数

# カイ二乗分布に従う乱数を生成
chi_squared_samples = np.random.chisquare(df=degrees_of_freedom, size=num_simulations)

# 平方根 E[√Y] のシミュレーション
sqrt_Y_simulation = np.mean(np.sqrt(chi_squared_samples))

# 標本標準偏差 S のシミュレーション
S_simulation = np.mean(sigma * np.sqrt(chi_squared_samples / (n - 1)))

# 理論値 E[√Y] と E[S] の計算
E_sqrt_Y_theoretical = np.sqrt(2) * gamma(n / 2) / gamma((n - 1) / 2)
E_S_theoretical = sigma * np.sqrt(2 / (n - 1)) * gamma(n / 2) / gamma((n - 1) / 2)

# 結果表示
print(f"平方根 E[√Y] の理論値: {E_sqrt_Y_theoretical:.4f}")
print(f"平方根 E[√Y] のシミュレーション結果: {sqrt_Y_simulation:.4f}")
print(f"標本標準偏差 E[S] の理論値: {E_S_theoretical:.4f}")
print(f"標本標準偏差 E[S] のシミュレーション結果: {S_simulation:.4f}")

# ヒストグラムの描画
plt.figure(figsize=(10, 6))

# 平方根 E[√Y] のヒストグラム
plt.hist(np.sqrt(chi_squared_samples), bins=50, alpha=0.5, color='b', edgecolor='black', label='sqrt(Y) サンプル', density=True)

# 標本標準偏差 E[S] のヒストグラム
plt.hist(sigma * np.sqrt(chi_squared_samples / (n - 1)), bins=50, alpha=0.5, color='r', edgecolor='black', label='S サンプル', density=True)

# 平方根 E[√Y] の理論値の線
plt.axvline(E_sqrt_Y_theoretical, color='blue', linestyle='dashed', linewidth=2, label='理論 E[√Y]')

# 標本標準偏差 E[S] の理論値の線
plt.axvline(E_S_theoretical, color='red', linestyle='dashed', linewidth=2, label='理論 E[S]')

# グラフの設定
plt.title('平方根 E[√Y] と 標本標準偏差 E[S] の分布')
plt.xlabel('値')
plt.ylabel('頻度')
plt.legend()
plt.grid(True)
plt.show()
平方根 E[√Y] の理論値: 2.9180
平方根 E[√Y] のシミュレーション結果: 2.9222
標本標準偏差 E[S] の理論値: 1.9453
標本標準偏差 E[S] のシミュレーション結果: 1.9481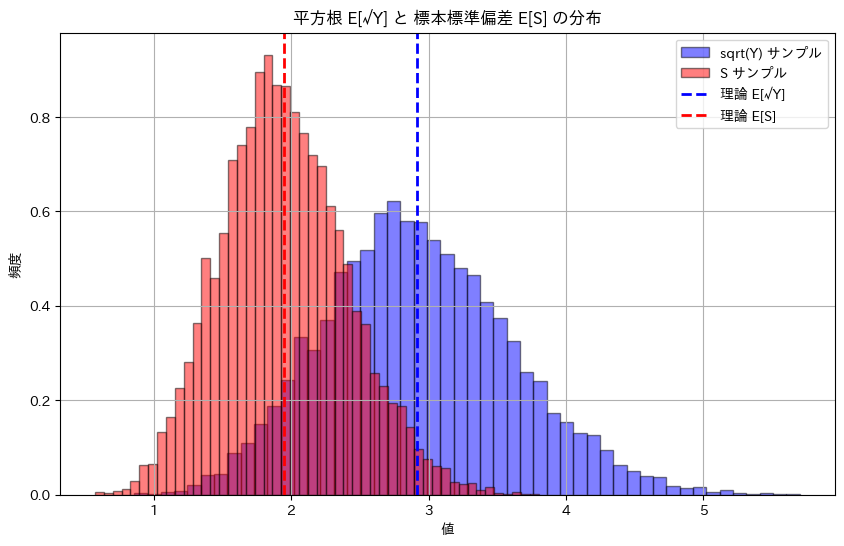
シミュレーションによる期待値E[√Y]とE[S]は理論値に近い値をとりました。E[S^2]=σ^2であっても面白いことにE[S]=σにはならない。上の例ではσ=2ですがシミュレーションと一致しません。標本標準偏差 Sは母標準偏差 σの不偏推定量ではないためです。
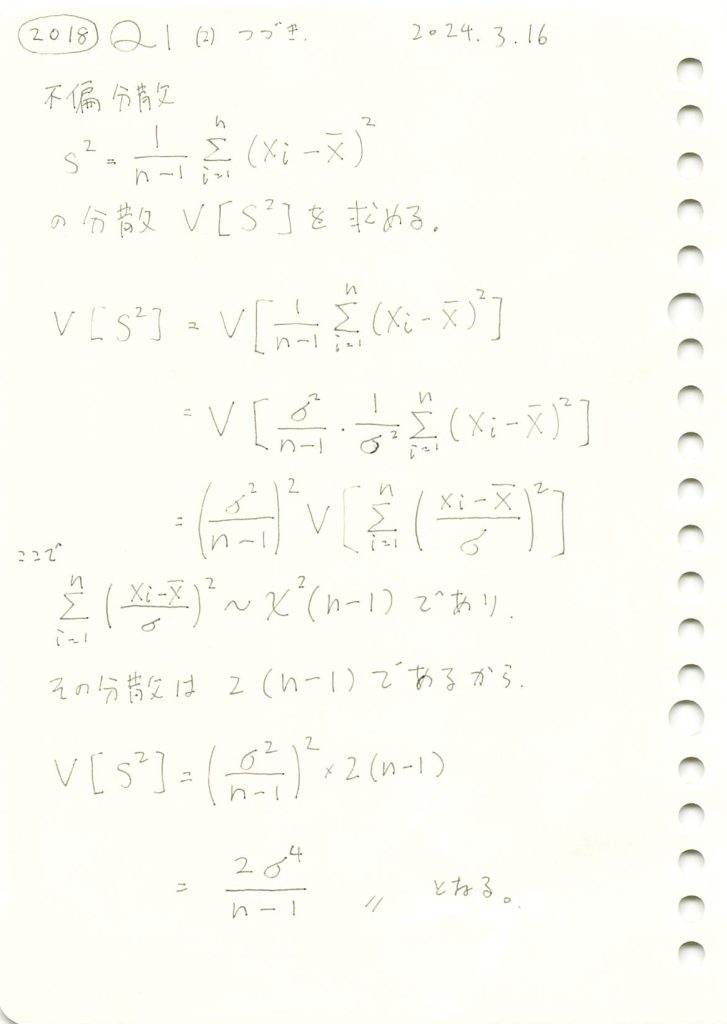
2018 Q1(2)-3
不偏分散の分散を求めました。
コード
数値シミュレーションにより標本分散の分散を求めてみます。
# 2018 Q1(2)  2024.10.2

import numpy as np
import matplotlib.pyplot as plt

# パラメータ設定
sigma = 2   # 母分散の標準偏差
sigma_squared = sigma ** 2  # 母分散
n = 30      # サンプルサイズ
num_simulations = 10000  # シミュレーションの回数

# 理論上の標本分散の分散 Var(S^2)
theoretical_variance = (2 * sigma_squared ** 2) / (n - 1)

# シミュレーション結果を保存するリスト
sample_variances = []

# シミュレーションを繰り返す
for _ in range(num_simulations):
    # 正規分布 N(0, sigma^2) に従うサンプルを生成
    sample = np.random.normal(0, sigma, n)

    # 標本平均
    sample_mean = np.mean(sample)

    # 標本分散 (S^2)
    sample_variance = np.sum((sample - sample_mean) ** 2) / (n - 1)

    # 計算した標本分散をリストに追加
    sample_variances.append(sample_variance)

# サンプル分散の分散を計算
empirical_variance = np.var(sample_variances)

# 結果表示
print(f"理論的な標本分散の分散: {theoretical_variance:.4f}")
print(f"シミュレーションで得られた標本分散の分散: {empirical_variance:.4f}")

# ヒストグラムを描画して標本分散の分布を確認
plt.hist(sample_variances, bins=50, alpha=0.7, color='b', edgecolor='black')
plt.axvline(np.mean(sample_variances), color='r', linestyle='dashed', linewidth=2, label='平均分散')
plt.title('標本分散の分布')
plt.xlabel('標本分散 S^2')
plt.ylabel('頻度')
plt.legend()
plt.grid(True)
plt.show()
理論的な標本分散の分散: 1.1034
シミュレーションで得られた標本分散の分散: 1.1286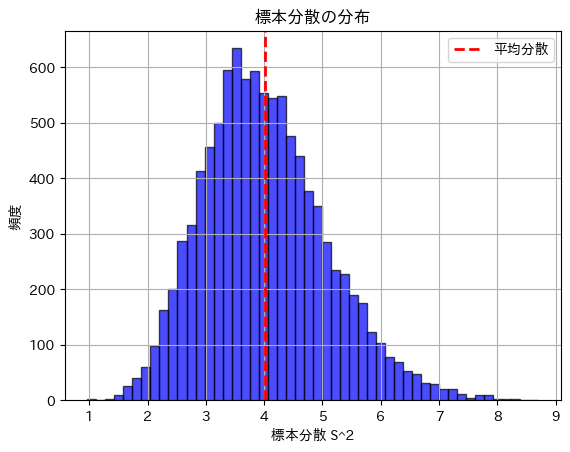
標本分散の分散は理論値に近い値になりました。
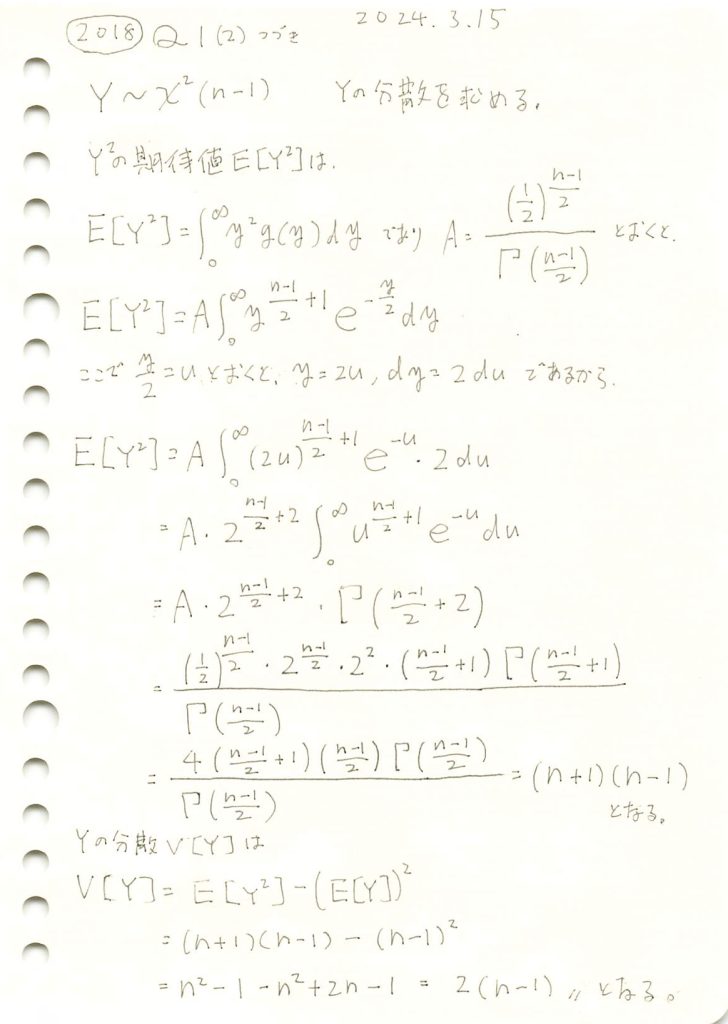
2018 Q1(2)-2
カイ二乗分布の分散を求めました。
コード
数値シミュレーションにより、n=10(自由度9)のカイ二乗分布の期待値と分散を求めてみます。
# 2018 Q1(2)  2024.10.2

import numpy as np
import matplotlib.pyplot as plt

# パラメータ設定
n = 10  # サンプルサイズ (自由度は n-1)
degrees_of_freedom = n - 1  # 自由度
num_simulations = 10000  # シミュレーションの回数

# カイ二乗分布に従うランダム変数を生成
chi_squared_samples = np.random.chisquare(df=degrees_of_freedom, size=num_simulations)

# 期待値と分散を計算
empirical_mean = np.mean(chi_squared_samples)
empirical_variance = np.var(chi_squared_samples)

# 理論値
theoretical_mean = degrees_of_freedom  # 期待値 E[Y] = n-1
theoretical_variance = 2 * degrees_of_freedom  # 分散 Var(Y) = 2(n-1)

# 結果表示
print(f"カイ二乗分布の期待値 (理論): {theoretical_mean:.4f}")
print(f"カイ二乗分布の期待値 (シミュレーション): {empirical_mean:.4f}")
print(f"カイ二乗分布の分散 (理論): {theoretical_variance:.4f}")
print(f"カイ二乗分布の分散 (シミュレーション): {empirical_variance:.4f}")

# ヒストグラムを描画して確認
plt.hist(chi_squared_samples, bins=50, alpha=0.7, color='b', edgecolor='black')
plt.axvline(empirical_mean, color='r', linestyle='dashed', linewidth=2, label='シミュレーション平均')
plt.axvline(theoretical_mean, color='g', linestyle='dashed', linewidth=2, label='理論平均')
plt.title('カイ二乗分布 (自由度 10-1)')
plt.xlabel('値')
plt.ylabel('頻度')
plt.legend()
plt.grid(True)
plt.show()
カイ二乗分布の期待値 (理論): 9.0000
カイ二乗分布の期待値 (シミュレーション): 8.9728
カイ二乗分布の分散 (理論): 18.0000
カイ二乗分布の分散 (シミュレーション): 18.3530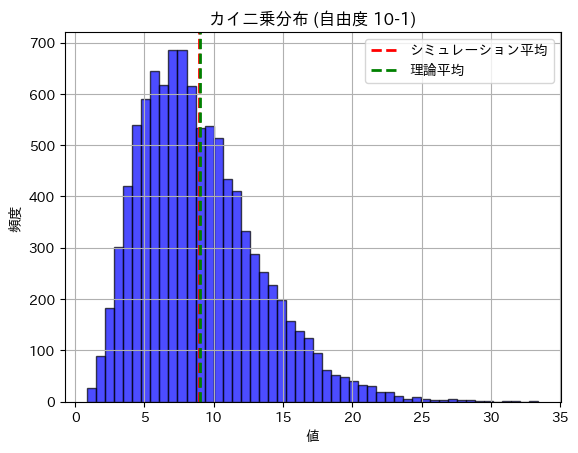
期待値と分散は理論値に近い値になりました。
2018 Q1(2)-1
カイ二乗分布の期待値を求めました。
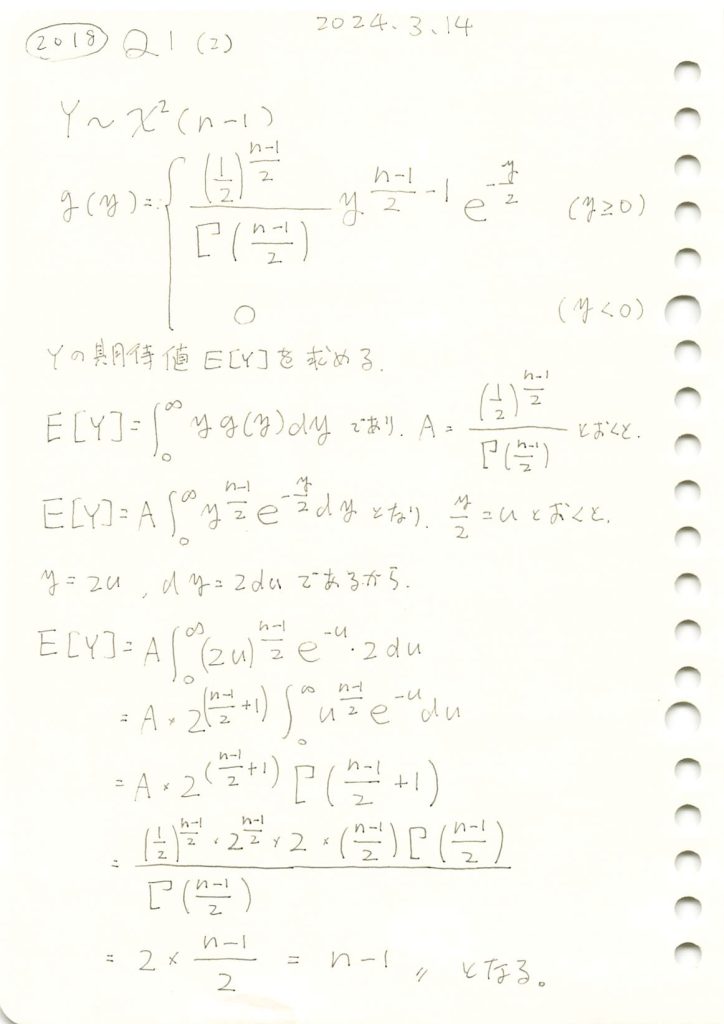
コード
数値シミュレーションにより、n=10(自由度9)のカイ二乗分布の期待値と分散を求めてみます。
# 2018 Q1(2)  2024.10.2

import numpy as np
import matplotlib.pyplot as plt

# パラメータ設定
n = 10  # サンプルサイズ (自由度は n-1)
degrees_of_freedom = n - 1  # 自由度
num_simulations = 10000  # シミュレーションの回数

# カイ二乗分布に従うランダム変数を生成
chi_squared_samples = np.random.chisquare(df=degrees_of_freedom, size=num_simulations)

# 期待値と分散を計算
empirical_mean = np.mean(chi_squared_samples)
empirical_variance = np.var(chi_squared_samples)

# 理論値
theoretical_mean = degrees_of_freedom  # 期待値 E[Y] = n-1
theoretical_variance = 2 * degrees_of_freedom  # 分散 Var(Y) = 2(n-1)

# 結果表示
print(f"カイ二乗分布の期待値 (理論): {theoretical_mean:.4f}")
print(f"カイ二乗分布の期待値 (シミュレーション): {empirical_mean:.4f}")
print(f"カイ二乗分布の分散 (理論): {theoretical_variance:.4f}")
print(f"カイ二乗分布の分散 (シミュレーション): {empirical_variance:.4f}")

# ヒストグラムを描画して確認
plt.hist(chi_squared_samples, bins=50, alpha=0.7, color='b', edgecolor='black')
plt.axvline(empirical_mean, color='r', linestyle='dashed', linewidth=2, label='シミュレーション平均')
plt.axvline(theoretical_mean, color='g', linestyle='dashed', linewidth=2, label='理論平均')
plt.title('カイ二乗分布 (自由度 10-1)')
plt.xlabel('値')
plt.ylabel('頻度')
plt.legend()
plt.grid(True)
plt.show()
カイ二乗分布の期待値 (理論): 9.0000
カイ二乗分布の期待値 (シミュレーション): 8.9728
カイ二乗分布の分散 (理論): 18.0000
カイ二乗分布の分散 (シミュレーション): 18.3530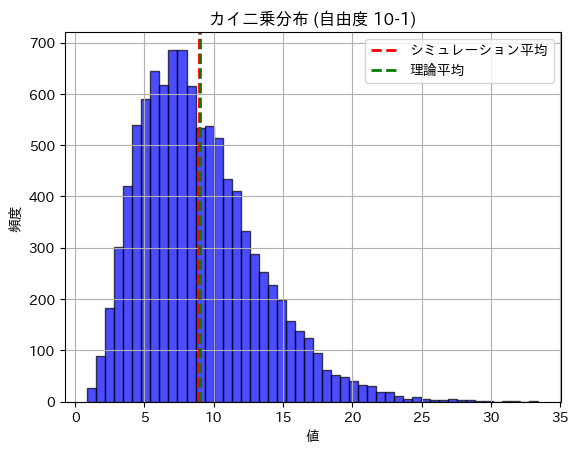
期待値と分散は理論値に近い値になりました。
次に、数値シミュレーションにより標本分散の分散を求めてみます。
# 2018 Q1(2)  2024.10.2

import numpy as np
import matplotlib.pyplot as plt

# パラメータ設定
sigma = 2   # 母分散の標準偏差
sigma_squared = sigma ** 2  # 母分散
n = 30      # サンプルサイズ
num_simulations = 10000  # シミュレーションの回数

# 理論上の標本分散の分散 Var(S^2)
theoretical_variance = (2 * sigma_squared ** 2) / (n - 1)

# シミュレーション結果を保存するリスト
sample_variances = []

# シミュレーションを繰り返す
for _ in range(num_simulations):
    # 正規分布 N(0, sigma^2) に従うサンプルを生成
    sample = np.random.normal(0, sigma, n)

    # 標本平均
    sample_mean = np.mean(sample)

    # 標本分散 (S^2)
    sample_variance = np.sum((sample - sample_mean) ** 2) / (n - 1)

    # 計算した標本分散をリストに追加
    sample_variances.append(sample_variance)

# サンプル分散の分散を計算
empirical_variance = np.var(sample_variances)

# 結果表示
print(f"理論的な標本分散の分散: {theoretical_variance:.4f}")
print(f"シミュレーションで得られた標本分散の分散: {empirical_variance:.4f}")

# ヒストグラムを描画して標本分散の分布を確認
plt.hist(sample_variances, bins=50, alpha=0.7, color='b', edgecolor='black')
plt.axvline(np.mean(sample_variances), color='r', linestyle='dashed', linewidth=2, label='平均分散')
plt.title('標本分散の分布')
plt.xlabel('標本分散 S^2')
plt.ylabel('頻度')
plt.legend()
plt.grid(True)
plt.show()
理論的な標本分散の分散: 1.1034
シミュレーションで得られた標本分散の分散: 1.1286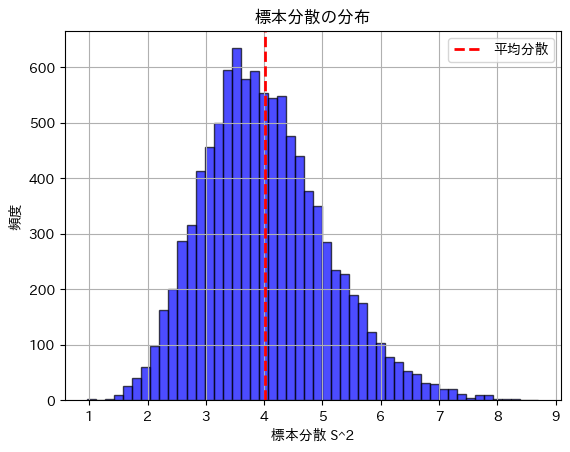
標本分散の分散は理論値に近い値になりました。
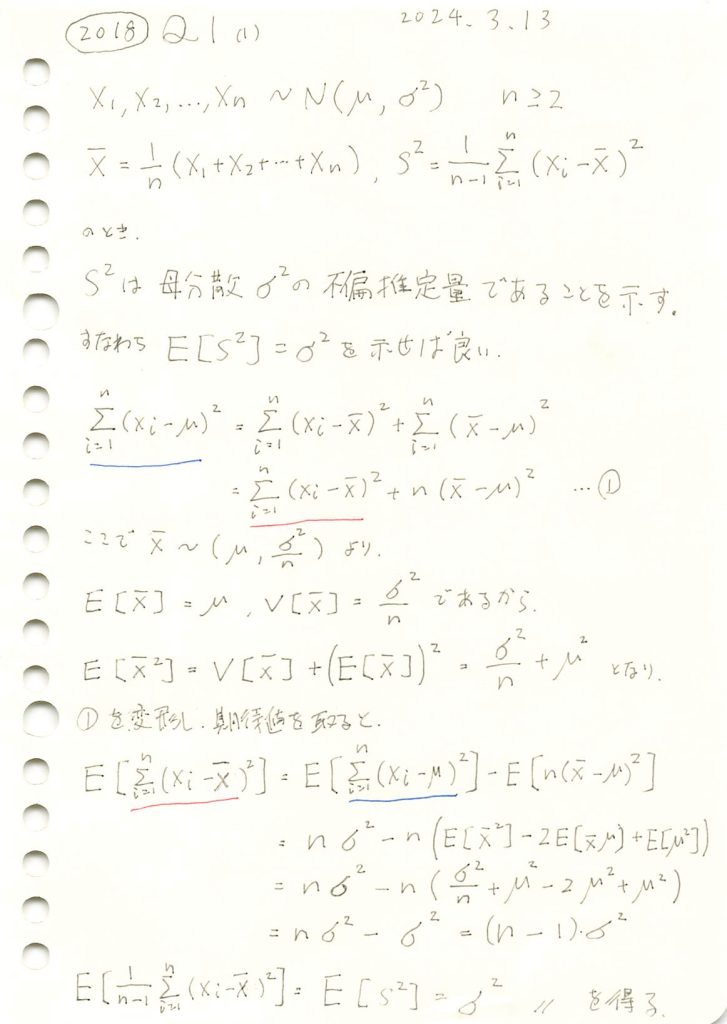
2018 Q1(1)
不偏分散が母分散の不偏推定量であることを示しました。
コード
nを2~100に変化させて、不偏分散と標本分散を比較してみます。
import numpy as np
import matplotlib.pyplot as plt

# パラメータ設定
mu = 0      # 母集団平均
sigma = 2   # 母集団標準偏差
sigma_squared = sigma ** 2  # 真の母分散
n_values = range(2, 101, 2)  # サンプルサイズ n を2から100まで2ステップで変化させる
num_trials = 3000  # 各 n に対して100回の試行を行う

# 不偏分散 (1/(n-1)) と 標本分散 (1/n) を計算するためのリスト
unbiased_variances = []
biased_variances = []

# 各サンプルサイズ n で分散を計算
for n in n_values:
    unbiased_variance_sum = 0
    biased_variance_sum = 0

    # 各サンプルサイズ n に対して複数回試行して平均を計算
    for _ in range(num_trials):
        # 正規分布に従うサンプルを生成
        sample = np.random.normal(mu, sigma, n)

        # 標本平均
        sample_mean = np.mean(sample)

        # 不偏分散 (1/(n-1))
        unbiased_variance = np.sum((sample - sample_mean) ** 2) / (n - 1)
        unbiased_variance_sum += unbiased_variance

        # 標本分散 (1/n)
        biased_variance = np.sum((sample - sample_mean) ** 2) / n
        biased_variance_sum += biased_variance

    # 各 n に対する平均分散をリストに追加
    unbiased_variances.append(unbiased_variance_sum / num_trials)
    biased_variances.append(biased_variance_sum / num_trials)

# グラフを描画
plt.plot(n_values, unbiased_variances, label="不偏分散 (1/(n-1))", color='blue', marker='o')
plt.plot(n_values, biased_variances, label="標本分散 (1/n)", color='red', linestyle='--', marker='x')

# 真の分散を水平線で描画
plt.axhline(y=sigma_squared, color='green', linestyle='-', label=f'真の分散 = {sigma_squared}')

# グラフの設定
plt.title('サンプルサイズに対する標本分散と不偏分散の比較')
plt.xlabel('サンプルサイズ n')
plt.ylabel('分散')
plt.legend()
plt.grid(True)
plt.show()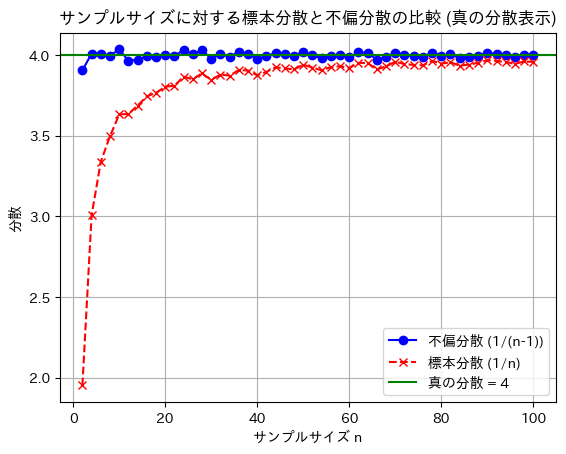
標本分散には不偏性はなく、不偏分散には不偏性があることが確認できました。