ホーム » 統計検定1級 2016年 統計数理 (ページ 3)
「統計検定1級 2016年 統計数理」カテゴリーアーカイブ
2016 Q1(1)
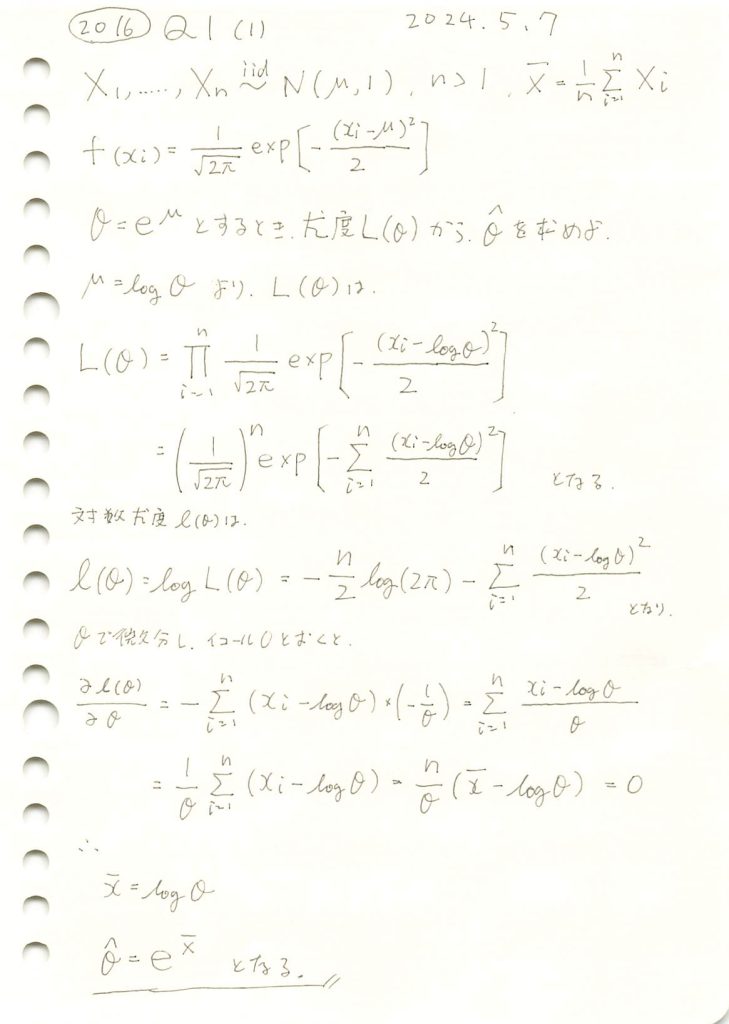
正規分布の母平均μに対してθ=exp(μ)をパラメータとする最尤推定を行いました。

コード
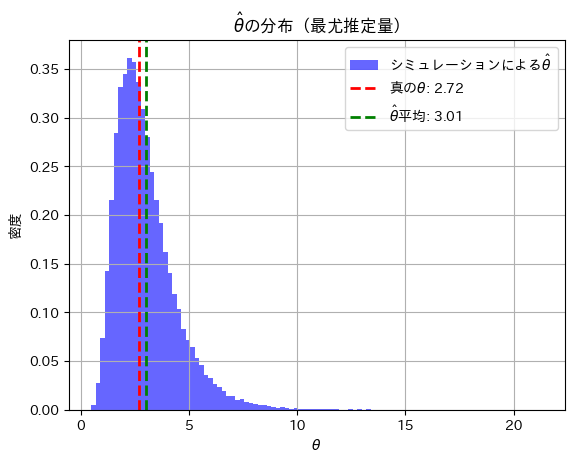
![]() が真のθに近づくか確認するためシミュレーションを行います。まずはサンプルサイズn=5でやってみます。
が真のθに近づくか確認するためシミュレーションを行います。まずはサンプルサイズn=5でやってみます。
# 2016 Q1(1)  2024.11.11

import numpy as np
import matplotlib.pyplot as plt

# シミュレーションのパラメータ
mu_true = 1.0  # 真の平均 (mu)
theta_true = np.exp(mu_true)  # 真の theta = e^mu
n_samples = 5  # サンプル数
n_trials = 100000  # シミュレーション試行回数

# 乱数生成と最尤推定量の計算
theta_estimates = []

for _ in range(n_trials):
    sample = np.random.normal(loc=mu_true, scale=1, size=n_samples)  # 正規分布からサンプルを生成
    mu_hat = np.mean(sample)  # 平均値を計算 (muの最尤推定量)
    theta_hat = np.exp(mu_hat)  # theta = e^mu の推定値
    theta_estimates.append(theta_hat)

# 真の値とシミュレーションの平均を計算
theta_hat_mean = np.mean(theta_estimates)

# 真の値と推定量の平均値を表示
print(f"真の θ: {theta_true:.4f}")
print(f"θハットの平均値 (シミュレーション): {theta_hat_mean:.4f}")

# グラフの描画
plt.hist(theta_estimates, bins=100, density=True, alpha=0.6, color='blue', label='シミュレーションによる$\hat{\\theta}$')
plt.axvline(theta_true, color='red', linestyle='dashed', linewidth=2, label=f'真の$\\theta$: {theta_true:.2f}')
plt.axvline(theta_hat_mean, color='green', linestyle='dashed', linewidth=2, label=f'$\\hat{{\\theta}}$平均: {theta_hat_mean:.2f}')
plt.title('$\\hat{\\theta}$の分布(最尤推定量)')
plt.xlabel('$\\theta$')
plt.ylabel('密度')
plt.legend()
plt.grid(True)
plt.show()
真の θ: 2.7183
θハットの平均値 (シミュレーション): 3.0120
![]() と真のθの間に少し乖離が見られます。サンプルサイズnが小さいことが起因しているかもしれません。
と真のθの間に少し乖離が見られます。サンプルサイズnが小さいことが起因しているかもしれません。
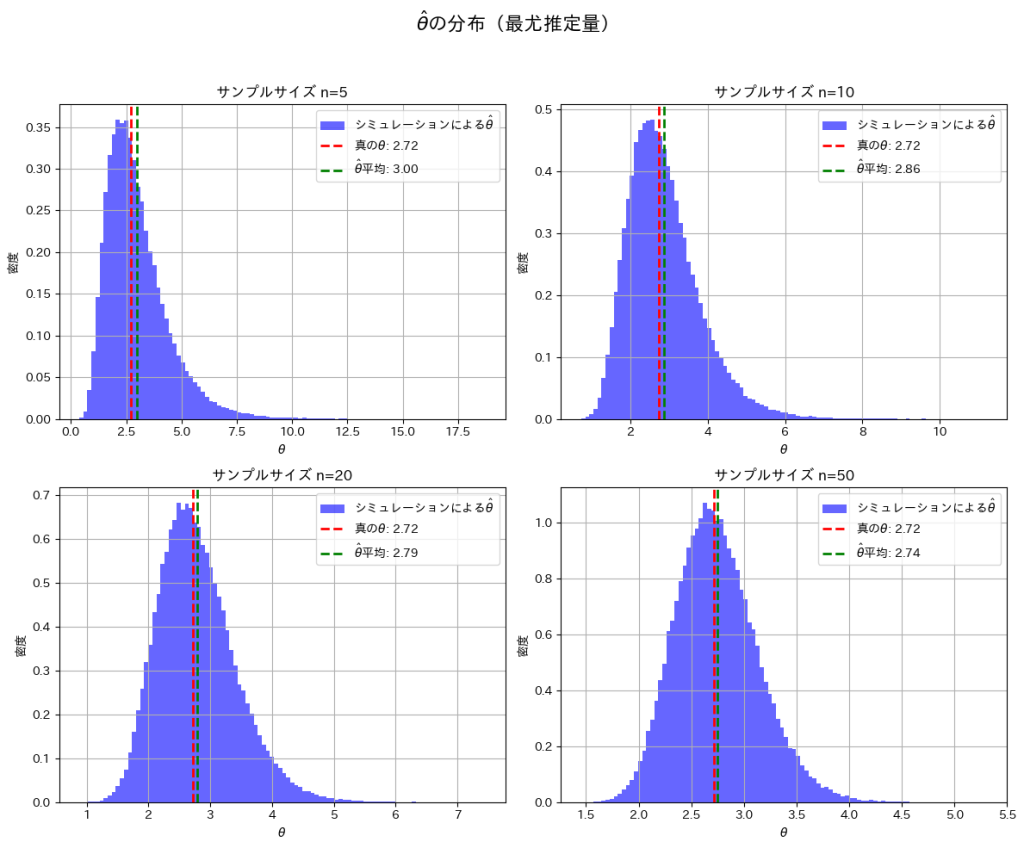
次に、サンプルサイズn=5, 10, 20, 50と変化させて、この乖離がどのように変わるかを確認してみます。
# 2016 Q1(1)  2024.11.11

import numpy as np
import matplotlib.pyplot as plt

# シミュレーションのパラメータ
mu_true = 1.0  # 真の平均 (mu)
theta_true = np.exp(mu_true)  # 真の theta = e^mu
n_trials = 100000  # シミュレーション試行回数
sample_sizes = [5, 10, 20, 50]  # サンプルサイズのリスト

fig, axes = plt.subplots(2, 2, figsize=(12, 10))
axes = axes.ravel()  # 2x2 の配列を平坦化

for i, n_samples in enumerate(sample_sizes):
    theta_estimates = []

    for _ in range(n_trials):
        sample = np.random.normal(loc=mu_true, scale=1, size=n_samples)
        mu_hat = np.mean(sample)
        theta_hat = np.exp(mu_hat)
        theta_estimates.append(theta_hat)

    theta_hat_mean = np.mean(theta_estimates)

    # ヒストグラムのプロット
    axes[i].hist(theta_estimates, bins=100, density=True, alpha=0.6, color='blue', label='シミュレーションによる$\hat{\\theta}$')
    axes[i].axvline(theta_true, color='red', linestyle='dashed', linewidth=2, label=f'真の$\\theta$: {theta_true:.2f}')
    axes[i].axvline(theta_hat_mean, color='green', linestyle='dashed', linewidth=2, label=f'$\\hat{{\\theta}}$平均: {theta_hat_mean:.2f}')
    axes[i].set_title(f'サンプルサイズ n={n_samples}')
    axes[i].set_xlabel('$\\theta$')
    axes[i].set_ylabel('密度')
    axes[i].legend()
    axes[i].grid(True)

plt.suptitle('$\\hat{\\theta}$の分布(最尤推定量)', fontsize=16)
plt.tight_layout(rect=[0, 0, 1, 0.95])
plt.show()
nを大きくすることで、![]() と真のθの間の乖離が小さくなることを確認できました。
と真のθの間の乖離が小さくなることを確認できました。