ホーム » 統計検定1級 2015年 統計数理
「統計検定1級 2015年 統計数理」カテゴリーアーカイブ
2015 Q5(6)
二変量正規分布の条件付期待値を求め、二値化された条件付確率変数との相関係数を求めました。
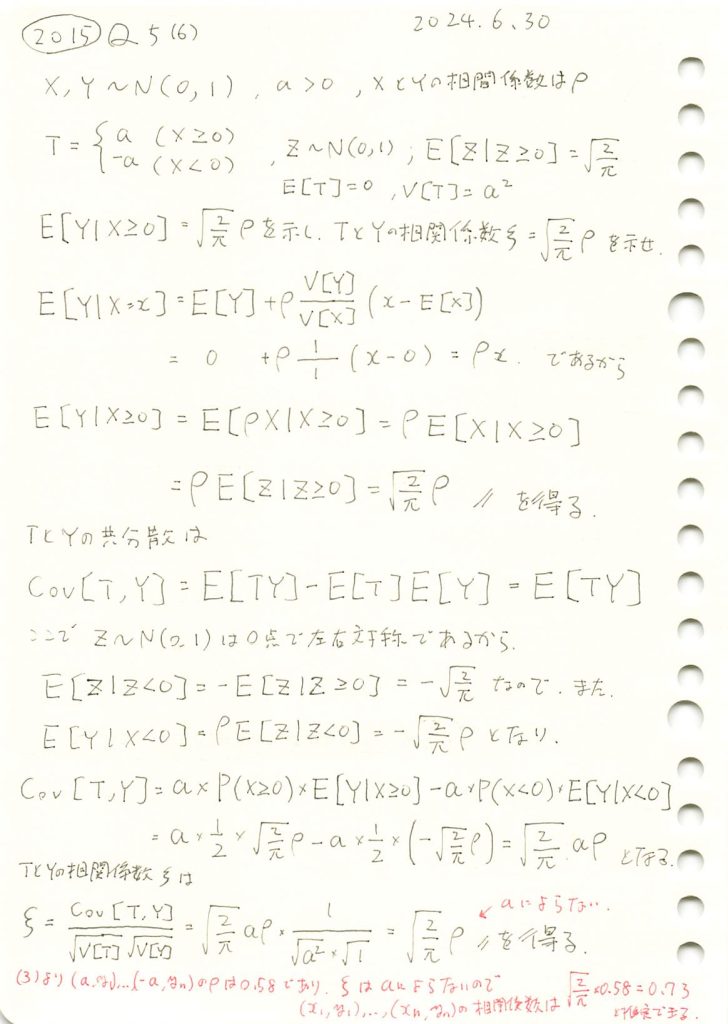
コード
条件付期待値![]() と相関係数
と相関係数 ![]() が、理論値
が、理論値![]() に一致することをシミュレーションで確認します。
に一致することをシミュレーションで確認します。
# 2015 Q5(6)  2024.12.27

import numpy as np
import matplotlib.pyplot as plt

# パラメータ設定
rho = 0.8  # 相関係数
num_samples = 100000  # サンプル数

# 2次元正規分布の生成
mean = [0, 0]  # 平均
cov = [[1, rho], [rho, 1]]  # 共分散行列
X, Y = np.random.multivariate_normal(mean, cov, num_samples).T

# 条件 X >= 0 の Y の期待値 (シミュレーション)
Y_given_X_positive = Y[X >= 0]
simulated_mean = np.mean(Y_given_X_positive)

# 理論値の計算
theoretical_mean = np.sqrt(2 / np.pi) * rho

# T の定義 (a = 1 と仮定)
a = 1
T = np.where(X >= 0, a, -a)

# 相関係数の計算 (T と Y)
simulated_corr = np.corrcoef(T, Y)[0, 1]
theoretical_corr = np.sqrt(2 / np.pi) * rho

# 結果の表示
print("シミュレーション結果:")
print(f"E[Y | X >= 0] (シミュレーション): {simulated_mean:.4f}")
print(f"E[Y | X >= 0] (理論値): {theoretical_mean:.4f}")
print(f"相関係数 Corr(T, Y) (シミュレーション): {simulated_corr:.4f}")
print(f"相関係数 Corr(T, Y) (理論値): {theoretical_corr:.4f}")

# ヒストグラムの描画
plt.figure(figsize=(10, 6))
plt.hist(Y_given_X_positive, bins=50, density=True, color='lightblue', edgecolor='black', alpha=0.7, label="Y | X >= 0 の分布")
plt.axvline(simulated_mean, color="green", linestyle="--", label=f"シミュレーション期待値: {simulated_mean:.4f}")
plt.axvline(theoretical_mean, color="red", linestyle="--", label=f"理論期待値: {theoretical_mean:.4f}")

# グラフの設定
plt.title("条件付き期待値 E[Y | X >= 0] の確認", fontsize=14)
plt.xlabel("Y の値", fontsize=12)
plt.ylabel("確率密度", fontsize=12)
plt.legend(fontsize=10)
plt.grid(True)
plt.tight_layout()
plt.show()
シミュレーション結果:
E[Y | X >= 0] (シミュレーション): 0.6386
E[Y | X >= 0] (理論値): 0.6383
相関係数 Corr(T, Y) (シミュレーション): 0.6384
相関係数 Corr(T, Y) (理論値): 0.6383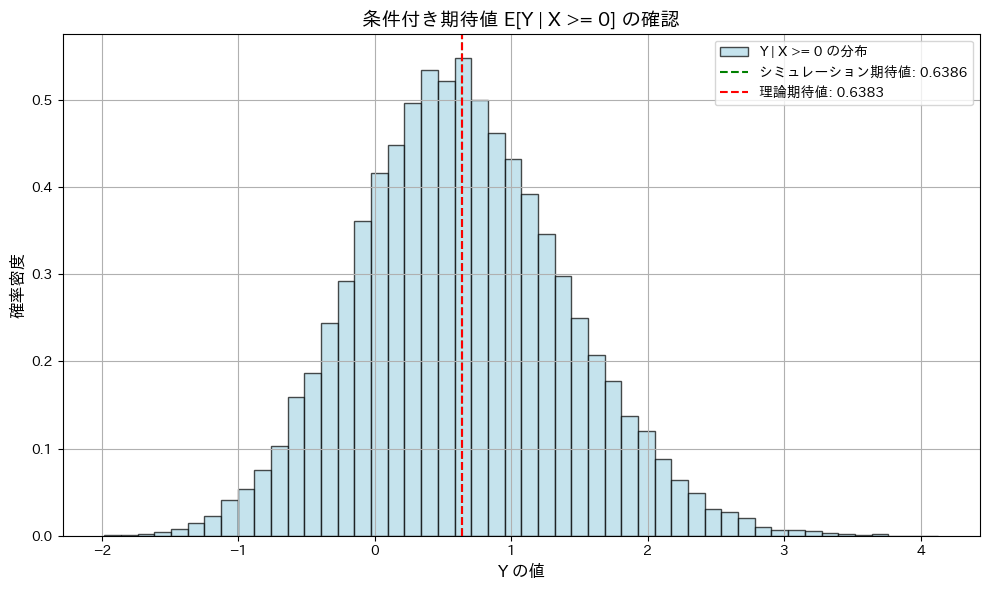
条件付期待値![]() と相関係数
と相関係数 ![]() が、共に理論値
が、共に理論値![]() に一致することが確認されました。
に一致することが確認されました。
次に、相関係数 ![]() がaの値に依らず一定であることを確認します。また、いくつかの相関係数
がaの値に依らず一定であることを確認します。また、いくつかの相関係数![]() を変化させて確認します。
を変化させて確認します。
# 2015 Q5(6)  2024.12.27

import numpy as np
import matplotlib.pyplot as plt

# パラメータ設定
rho_values = [0.2, 0.5, 0.8]  # いくつかの相関係数 ρ
a_values = np.linspace(0.1, 5, 50)  # a の範囲
num_samples = 100000  # サンプル数

# 結果を格納する辞書
results = {rho: [] for rho in rho_values}

# シミュレーション
for rho in rho_values:
    mean = [0, 0]  # 平均
    cov = [[1, rho], [rho, 1]]  # 共分散行列

    for a in a_values:
        # 2次元正規分布の生成
        X, Y = np.random.multivariate_normal(mean, cov, num_samples).T

        # T の定義
        T = np.where(X >= 0, a, -a)

        # 相関係数の計算
        simulated_corr = np.corrcoef(T, Y)[0, 1]
        results[rho].append(simulated_corr)

# グラフの描画
plt.figure(figsize=(10, 6))
for rho, corr_values in results.items():
    plt.plot(a_values, corr_values, label=f"ρ = {rho}")

# 理論値の計算
theoretical_corr = np.sqrt(2 / np.pi) * np.array(rho_values)

# グラフの設定
plt.title("T と Y の相関係数 (Corr(T, Y)) vs a", fontsize=14)
plt.xlabel("a の値", fontsize=12)
plt.ylabel("相関係数 Corr(T, Y)", fontsize=12)
plt.axhline(y=0, color="black", linestyle="--", linewidth=0.8)  # 基準線
plt.legend(fontsize=10)
plt.grid(True)
plt.tight_layout()
plt.show()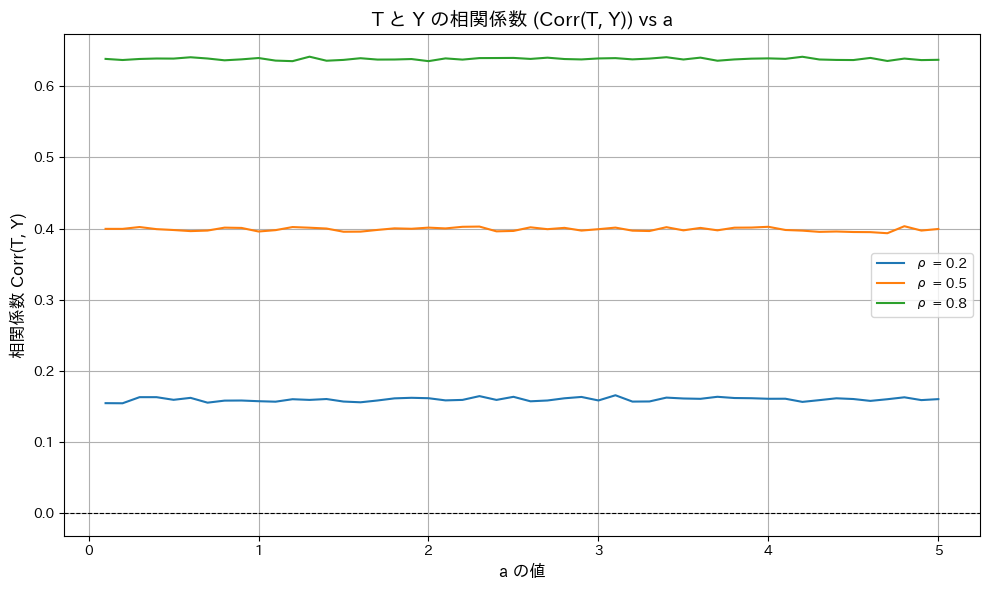
相関係数 ![]() がaの値に依らず一定であることが確認されました。
がaの値に依らず一定であることが確認されました。
2015 Q5(5)
標準正規分布に従う確率変数を条件に二値化する確率変数の平均と分散を求めました。
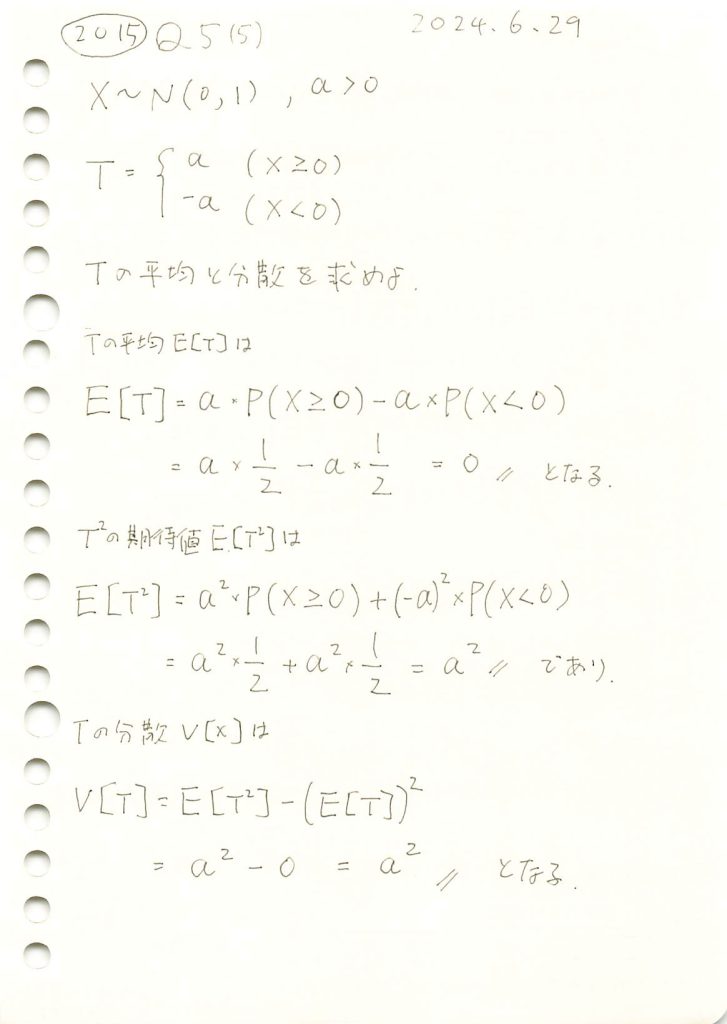
コード
Tの平均と分散をシミュレーションで計算し、それらが理論値と一致するか確認をします。
# 2015 Q5(5)  2024.12.26

import numpy as np

# パラメータ
a = 2  # a の値
num_samples = 100000  # サンプル数

# 正規分布から X を生成
X = np.random.normal(0, 1, num_samples)

# T を定義
T = np.where(X >= 0, a, -a)

# 平均と分散を計算
T_mean = np.mean(T)
T_variance = np.var(T)

# 結果を出力
print("シミュレーション結果:")
print("T の平均 (E[T]):", T_mean)
print("T の分散 (Var(T)):", T_variance)

# 理論値
print("\n理論値:")
print("T の平均 (E[T]):", 0)
print("T の分散 (Var(T)):", a**2)
シミュレーション結果:
T の平均 (E[T]): 0.00388
T の分散 (Var(T)): 3.999984945600001
理論値:
T の平均 (E[T]): 0
T の分散 (Var(T)): 4シミュレーションで計算したTの平均と分散は理論値と一致しました。
2015 Q5(4)
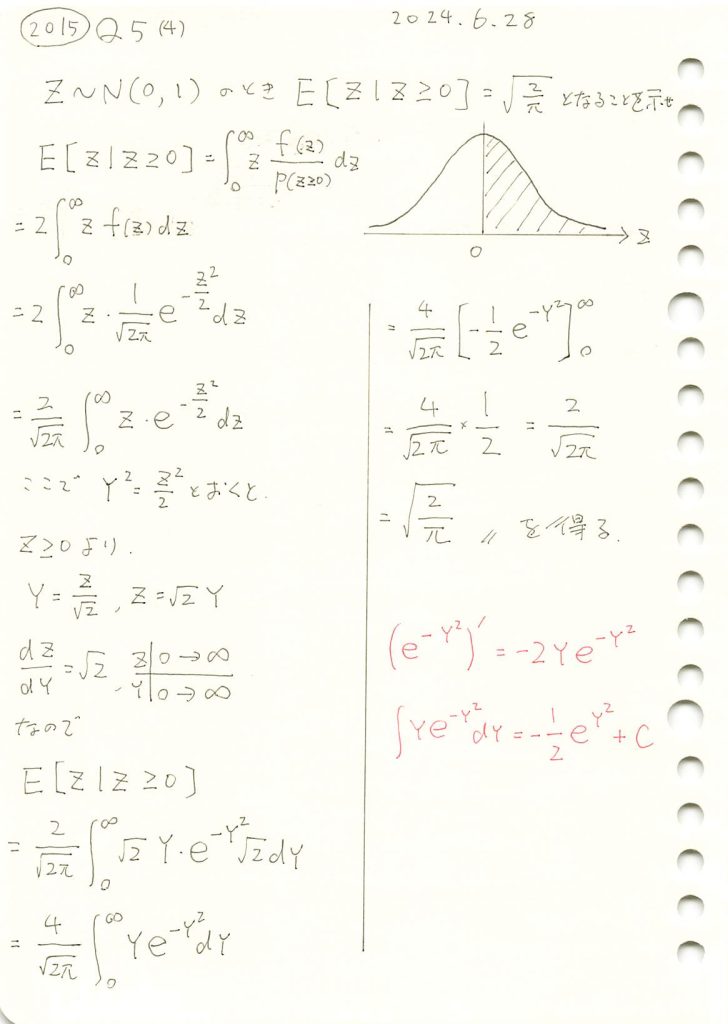
標準正規分布に従う確率変数の、右半分の条件付期待値を求めました。
コード
標準正規分布に従う確率変数 Zについて、条件付き期待値![]() になることをシミュレーションで確認をします。
になることをシミュレーションで確認をします。
# 2015 Q5(4)  2024.12.25

import numpy as np
import matplotlib.pyplot as plt
from scipy.stats import norm

# シミュレーションパラメータ
num_samples = 100000  # サンプル数

# 標準正規分布からサンプルを生成
samples = np.random.normal(0, 1, num_samples)

# 条件 Z >= 0 のサンプルを抽出
samples_positive = samples[samples >= 0]

# 条件付き期待値のシミュレーション値
simulated_mean = np.mean(samples_positive)

# 理論値
theoretical_mean = np.sqrt(2 / np.pi)

# ヒストグラムの準備
x = np.linspace(-3, 3, 500)  # x軸の範囲
pdf = norm.pdf(x)  # 標準正規分布のPDF

# グラフの描画
plt.figure(figsize=(10, 6))

# 正規分布のPDF
plt.plot(x, pdf, label="標準正規分布のPDF", color="blue", linewidth=2)

# 条件 Z >= 0 のサンプルのヒストグラム
plt.hist(samples_positive, bins=50, density=True, alpha=0.6, color="orange", label="条件 Z ≧ 0 のシミュレーション")

# 結果の表示
plt.axvline(simulated_mean, color="green", linestyle="--", label=f"シミュレーション期待値: {simulated_mean:.4f}")
plt.axvline(theoretical_mean, color="red", linestyle="--", label=f"理論期待値: {theoretical_mean:.4f}")

# グラフの設定
plt.title("条件付き期待値の確認 (Z ≧ 0)", fontsize=14)
plt.xlabel("Z の値", fontsize=12)
plt.ylabel("確率密度", fontsize=12)
plt.legend(fontsize=10)
plt.grid(True)

# グラフを表示
plt.tight_layout()
plt.show()
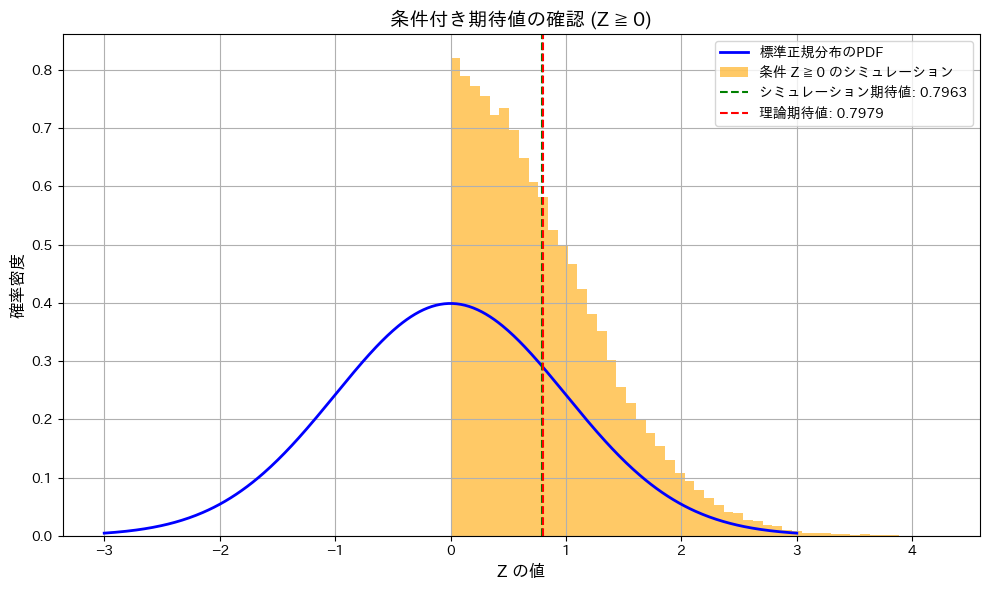
条件付き期待値![]() であることが確認されました。
であることが確認されました。
2015 Q5(3)
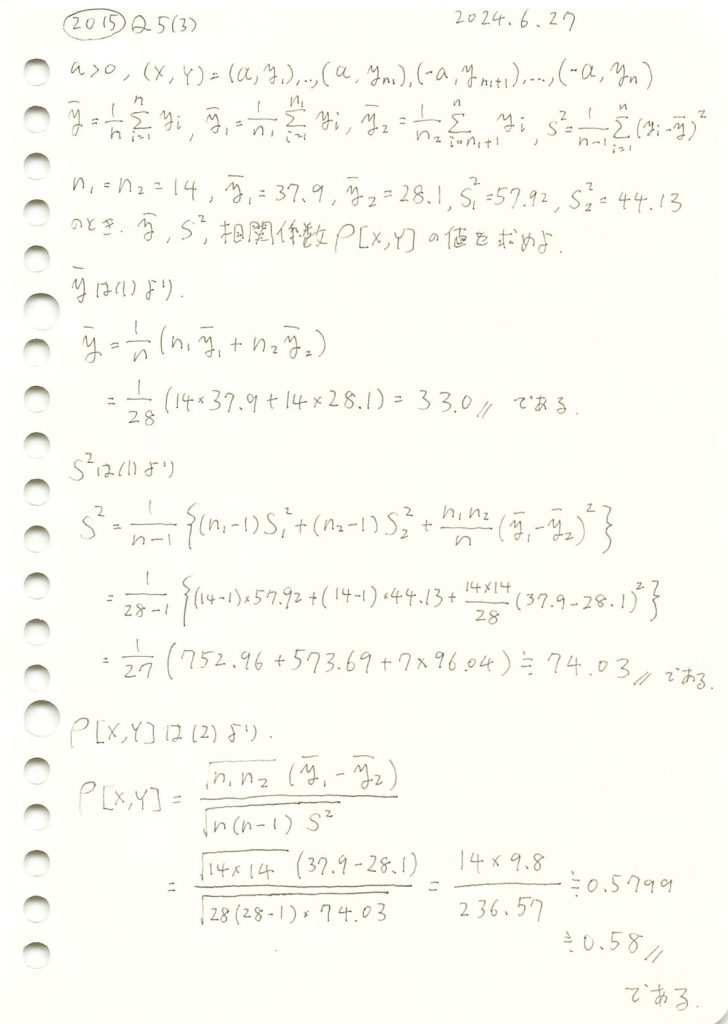
2つに分けられた組標本のそれぞれ平均と不偏分散の具体的な値から、全体の平均と不偏分散および相関係数を計算しました。
コード
与えられたデータを基に、全体の平均と分散を計算し、相関係数を求めます。
# 2015 Q5(3)  2024.12.24

# 与えられたデータ
n1 = n2 = 14
n = n1 + n2
y1_bar = 37.9
y2_bar = 28.1
s1_sq = 57.92
s2_sq = 44.13

# 全体の平均
y_bar = (n1 * y1_bar + n2 * y2_bar) / n

# 全体の分散
s_sq = (
    ((n1 - 1) * s1_sq + (n2 - 1) * s2_sq) / (n - 1)
    + (n1 * n2 / n) * ((y1_bar - y2_bar) ** 2) / (n - 1)
)

# 相関係数
numerator = (n1 * n2) ** 0.5 * (y1_bar - y2_bar)
denominator = (n * (n - 1) * s_sq) ** 0.5
r = numerator / denominator

# 結果出力
print("全体の平均 (y_bar):", y_bar)
print("全体の分散 (s^2):", s_sq)
print("相関係数 (r):", r)
全体の平均 (y_bar): 33.0
全体の分散 (s^2): 74.03444444444443
相関係数 (r): 0.5799309710329085与えられたデータを基に、全体の平均と分散を計算し、相関係数を求め、解答と一致することを確認しました。
2015 Q5(2)
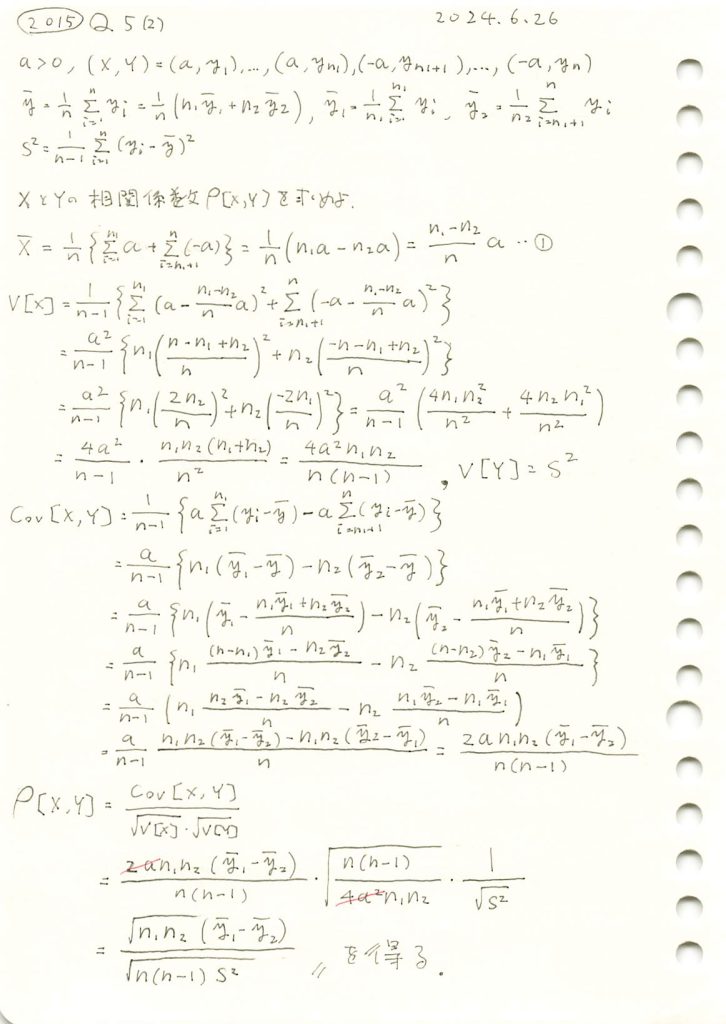
組標本の相関係数を、2つに分けられた組標本のそれぞれ平均と全体の不偏分散で表現しました。
コード
与えられた式を用いて計算した相関系数と、通常の定義式を用いて計算した相関係数が一致するかシミュレーションで確認をします。
# 2015 Q5(2)  2024.12.23

import numpy as np
import matplotlib.pyplot as plt

# シミュレーションパラメータ
n1 = 30  # グループ1のサンプル数
n2 = 20  # グループ2のサンプル数
n = n1 + n2  # 全体のサンプル数
simulations = 1000  # シミュレーションの回数

# 結果を格納するリスト
custom_r_values = []  # 式で計算した相関係数
standard_r_values = []  # 通常の相関係数

for _ in range(simulations):
    # y の生成 (正規分布)
    y1 = np.random.normal(0, 1, n1)
    y2 = np.random.normal(0, 1, n2)
    y = np.concatenate([y1, y2])

    # a の生成
    a_values = np.concatenate([np.full(n1, 1), np.full(n2, -1)])

    # 平均と分散
    y_bar = np.mean(y)
    s_sq_y = np.var(y, ddof=1)

    # 共分散
    covariance_manual = np.mean((y - y_bar) * (a_values - np.mean(a_values)))

    # 通常の相関係数
    standard_r = covariance_manual / np.sqrt(s_sq_y * np.var(a_values, ddof=1))
    standard_r_values.append(standard_r)

    # 式での相関係数
    y1_bar = np.mean(y1)
    y2_bar = np.mean(y2)
    numerator_custom = np.sqrt(n1 * n2) * (y1_bar - y2_bar)
    denominator_custom = np.sqrt(n * (n - 1) * s_sq_y)
    custom_r = numerator_custom / denominator_custom
    custom_r_values.append(custom_r)

# グラフの描画
plt.figure(figsize=(8, 8))
plt.scatter(custom_r_values, standard_r_values, alpha=0.5, color='blue', label=r"$r = \frac{\sqrt{n_1 n_2} (\bar{y}_1 - \bar{y}_2)}{\sqrt{n(n-1)s^2}}$")
plt.plot([min(custom_r_values), max(custom_r_values)], [min(custom_r_values), max(custom_r_values)], color='red', linestyle='--', label=r"$r = \frac{\mathrm{Cov}(X, Y)}{\sqrt{\mathrm{Var}(X)\mathrm{Var}(Y)}}$")
plt.title("相関係数の比較", fontsize=14)
plt.xlabel("式による相関係数", fontsize=12)
plt.ylabel("通常の相関係数", fontsize=12)
plt.legend()
plt.grid(True)
plt.tight_layout()
plt.show()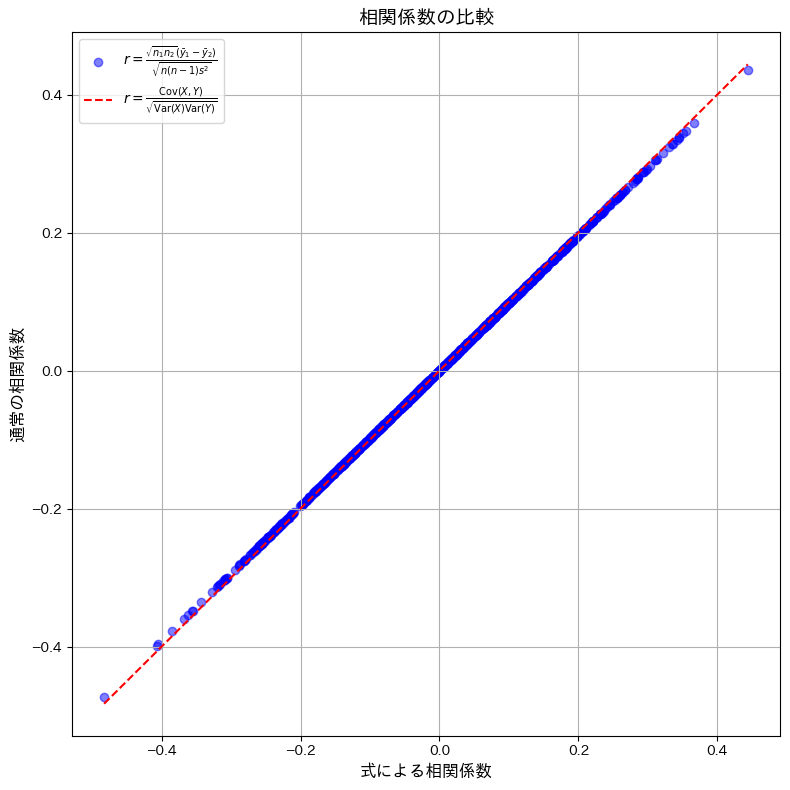
与えられた式を用いて計算した相関系数と、通常の定義式を用いて計算した相関係数が一致しました。わずかに観測された誤差は、浮動小数点演算による丸め誤差であると考えられます。
2015 Q5(1)
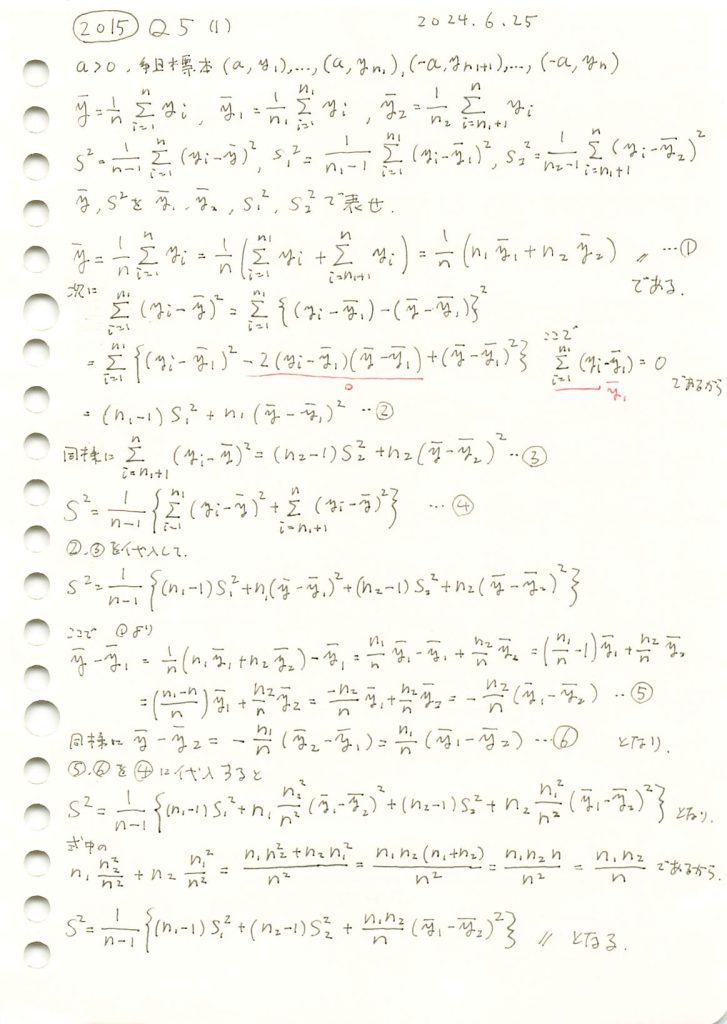
2つに分けられた標本それぞれの平均と不偏分散を用い、元の平均と不偏分散を式で表しました。
コード
直接アプローチと間接アプローチで求めた![]() と
と![]() が一致するか確認をします。
が一致するか確認をします。
# 2015 Q5(1)  2024.12.22

import numpy as np
import matplotlib.pyplot as plt

# シミュレーションパラメータ
n1 = 30  # グループ1のサンプル数
n2 = 20  # グループ2のサンプル数
n = n1 + n2  # 全体のサンプル数
simulations = 10000  # シミュレーションの回数

# 結果を格納するリスト
y_split = []  # 分割アプローチで計算した平均
y_direct = []  # 直接アプローチで計算した平均
s2_split = []  # 分割アプローチで計算した分散
s2_direct = []  # 直接アプローチで計算した分散

for _ in range(simulations):
    # ランダムサンプル生成 (正規分布 N(0, 1) を仮定)
    group1 = np.random.normal(0, 1, n1)
    group2 = np.random.normal(0, 1, n2)

    # グループごとの平均と分散
    y1_bar = np.mean(group1)
    y2_bar = np.mean(group2)
    s1_sq = np.var(group1, ddof=1)  # 分散 (不偏推定)
    s2_sq = np.var(group2, ddof=1)

    # 分割アプローチの平均と分散
    y_bar_split = (n1 * y1_bar + n2 * y2_bar) / n
    s_sq_split = (
        ((n1 - 1) * s1_sq + (n2 - 1) * s2_sq) / (n - 1)
        + (n1 * n2 / n) * (y1_bar - y2_bar) ** 2 / (n - 1)
    )

    # 直接アプローチの平均と分散
    all_data = np.concatenate([group1, group2])
    y_bar_direct = np.mean(all_data)
    s_sq_direct = np.var(all_data, ddof=1)

    # データを格納
    y_split.append(y_bar_split)
    y_direct.append(y_bar_direct)
    s2_split.append(s_sq_split)
    s2_direct.append(s_sq_direct)

# グラフの描画
fig, axes = plt.subplots(1, 2, figsize=(16, 8))

# 平均の比較
axes[0].scatter(y_split, y_direct, alpha=0.5, color='blue', label=r"分割アプローチ: $\bar{y} = \frac{1}{n}(n_1\bar{y}_1 + n_2\bar{y}_2)$")
axes[0].plot([min(y_split), max(y_split)], [min(y_split), max(y_split)], color='red', linestyle='--', label=r"直接アプローチ: $\bar{y} = \frac{1}{n} \sum_{i=1}^n y_i$")
axes[0].set_xlabel('分割アプローチ (平均)', fontsize=12)
axes[0].set_ylabel('直接アプローチ (平均)', fontsize=12)
axes[0].set_title('平均の比較: 分割 vs 直接', fontsize=14)
axes[0].legend()
axes[0].grid(True)

# 分散の比較
axes[1].scatter(s2_split, s2_direct, alpha=0.5, color='green', label=r"分割アプローチ: $s^2 = \frac{1}{n-1} \left\{(n_1-1)s_1^2 + (n_2-1)s_2^2 + \frac{n_1n_2}{n}(\bar{y}_1 - \bar{y}_2)^2 \right\}$")
axes[1].plot([min(s2_split), max(s2_split)], [min(s2_split), max(s2_split)], color='red', linestyle='--', label=r"直接アプローチ: $s^2 = \frac{1}{n-1}\sum_{i=1}^n (y_i - \bar{y})^2$")
axes[1].set_xlabel('分割アプローチ (分散)', fontsize=12)
axes[1].set_ylabel('直接アプローチ (分散)', fontsize=12)
axes[1].set_title('分散の比較: 分割 vs 直接', fontsize=14)
axes[1].legend()
axes[1].grid(True)

# グラフの表示
plt.tight_layout()
plt.show()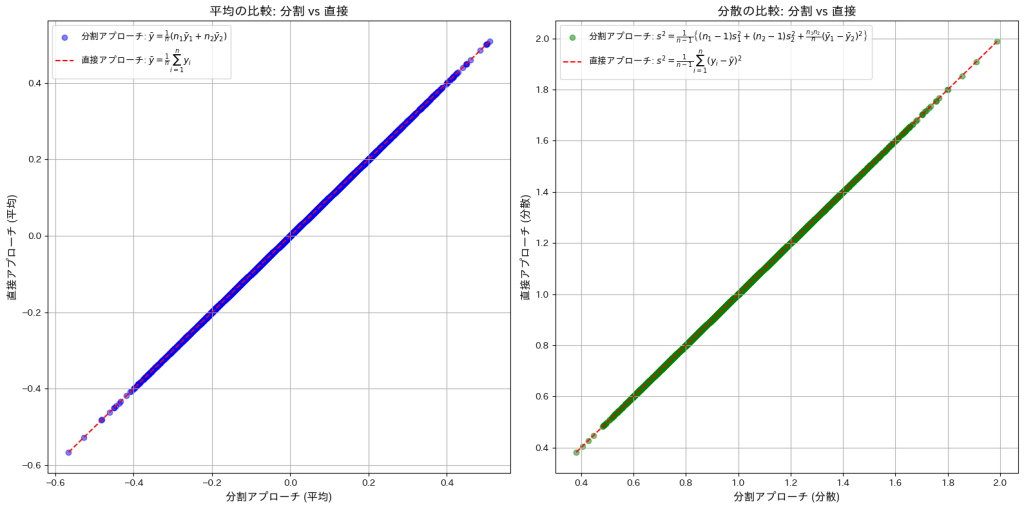
直接アプローチと間接アプローチで求めた![]() と
と![]() が一致しました。
が一致しました。
2015 Q4(5)
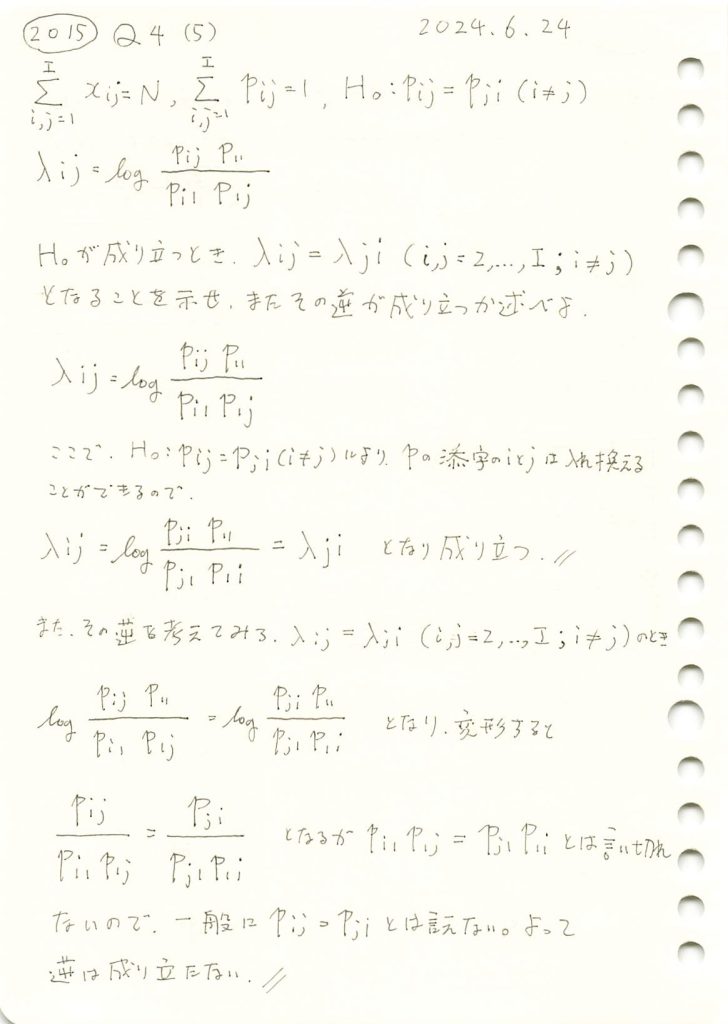
確率行列が対称行列であるとき、ある新しいパラメータ行列も対称であるか示し、更にその逆が成り立つかも調べました。
コード
セル確率![]() の対称性が成り立つ場合にパラメータ
の対称性が成り立つ場合にパラメータ![]() が対称性
が対称性![]() を持つことを確認します。
を持つことを確認します。
# 2015 Q4(5)  2024.12.21

import numpy as np
import seaborn as sns
import matplotlib.pyplot as plt

# 1. データ生成
np.random.seed(42)  # 再現性のためのシード値
I = 4  # 行列のサイズ
p_matrix_sym = np.random.rand(I, I)  # 対称性を持たないランダムな確率行列
p_matrix_sym = (p_matrix_sym + p_matrix_sym.T) / 2  # 対称性を強制

# 対称性が成り立たない確率行列
p_matrix_asym = np.random.rand(I, I)
p_matrix_asym = p_matrix_asym / np.sum(p_matrix_asym)  # 正規化

# 正規化して確率にする
p_matrix_sym = p_matrix_sym / np.sum(p_matrix_sym)

# 2. λ_ij の計算関数
def calculate_lambda(p_matrix):
    I = p_matrix.shape[0]
    lambdas = np.zeros((I, I))
    for i in range(1, I):
        for j in range(1, I):
            lambdas[i, j] = np.log(p_matrix[i, j] * p_matrix[0, 0] / (p_matrix[i, 0] * p_matrix[0, j]))
    return lambdas

# 対称性の仮説が成り立つ場合の λ_ij
lambda_sym = calculate_lambda(p_matrix_sym)

# 対称性の仮説が成り立たない場合の λ_ij
lambda_asym = calculate_lambda(p_matrix_asym)

# 3. 可視化: ヒートマップをプロット
fig, axes = plt.subplots(2, 2, figsize=(12, 10))

# 対称性が成り立つ確率行列
sns.heatmap(p_matrix_sym, annot=True, fmt=".3f", cmap="Blues", ax=axes[0, 0])
axes[0, 0].set_title("対称性が成り立つ確率行列 $p_{ij}$")

# 対称性が成り立つ λ_ij 行列
sns.heatmap(lambda_sym, annot=True, fmt=".3f", cmap="Greens", ax=axes[0, 1])
axes[0, 1].set_title("対称性が成り立つ場合の $\lambda_{ij}$")

# 対称性が成り立たない確率行列
sns.heatmap(p_matrix_asym, annot=True, fmt=".3f", cmap="Reds", ax=axes[1, 0])
axes[1, 0].set_title("対称性が成り立たない確率行列 $p_{ij}$")

# 対称性が成り立たない λ_ij 行列
sns.heatmap(lambda_asym, annot=True, fmt=".3f", cmap="Purples", ax=axes[1, 1])
axes[1, 1].set_title("対称性が成り立たない場合の $\lambda_{ij}$")

plt.tight_layout()
plt.show()

# 4. λ_ij = λ_ji の確認
print("対称性が成り立つ場合:")
print("λ_ij == λ_ji:", np.allclose(lambda_sym, lambda_sym.T))

print("\n対称性が成り立たない場合:")
print("λ_ij == λ_ji:", np.allclose(lambda_asym, lambda_asym.T))
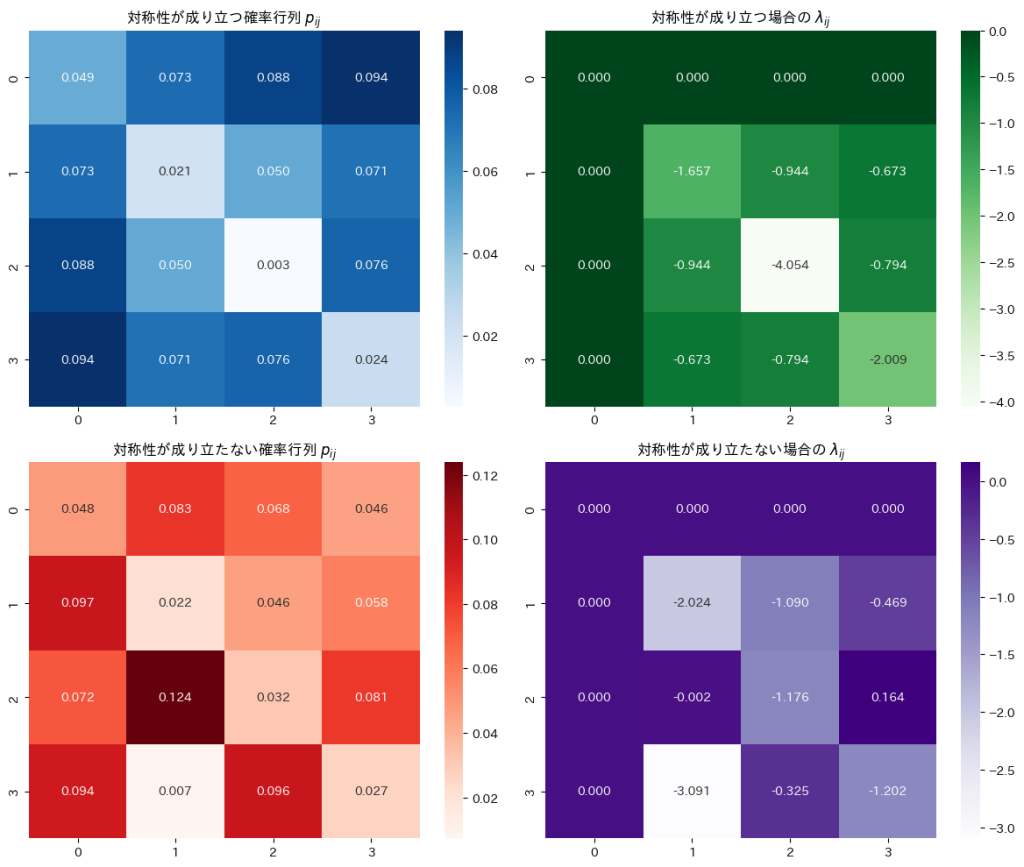
セル確率![]() の対称性が成り立つ場合に、パラメータ
の対称性が成り立つ場合に、パラメータ![]() が対称性
が対称性![]() を持つことを確認しました。
を持つことを確認しました。
2015 Q4(4)
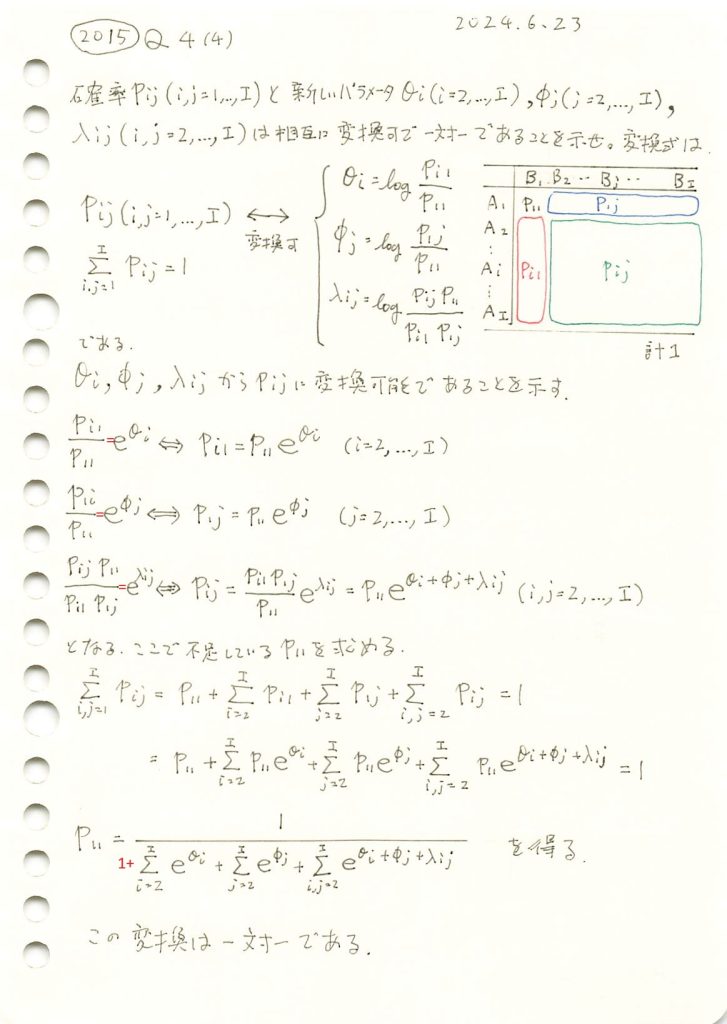
確率の正方行列と新しいパラメータが相互に変換可で一対一であることを確認しました。
コード
セル確率![]() を新しいパラメータ
を新しいパラメータ![]() に変換し、その逆変換を用いて元の
に変換し、その逆変換を用いて元の![]() を再構成することで、変換が一対一であることを確認します。
を再構成することで、変換が一対一であることを確認します。
import numpy as np

# セル確率 p_ij を与える (例として 3x3 の行列を使用)
p_ij = np.array([[0.2, 0.1, 0.05],
                 [0.15, 0.25, 0.05],
                 [0.05, 0.05, 0.1]])

I = p_ij.shape[0]

# 1. 与えられた p_ij から θ_i, φ_j, λ_ij を計算
p_11 = p_ij[0, 0]  # p_11 はセル (1, 1) の確率
theta_i = np.log(p_ij[1:, 0] / p_11)  # θ_i = log(p_i1 / p_11), i = 2, ..., I
phi_j = np.log(p_ij[0, 1:] / p_11)    # φ_j = log(p_1j / p_11), j = 2, ..., I
lambda_ij = np.zeros((I - 1, I - 1))  # λ_ij を初期化

for i in range(1, I):
    for j in range(1, I):
        lambda_ij[i - 1, j - 1] = np.log(p_ij[i, j] * p_11 / (p_ij[i, 0] * p_ij[0, j]))

# 2. θ_i, φ_j, λ_ij から p_ij を再構成
p_ij_reconstructed = np.zeros_like(p_ij)
p_ij_reconstructed[0, 0] = 1 / (
    1 +
    np.sum(np.exp(theta_i)) +
    np.sum(np.exp(phi_j)) +
    np.sum(np.exp(theta_i[:, None] + phi_j[None, :] + lambda_ij))
)

# 再構成した確率の計算
for i in range(I):
    for j in range(I):
        if i == 0 and j > 0:  # p_1j
            p_ij_reconstructed[i, j] = p_ij_reconstructed[0, 0] * np.exp(phi_j[j - 1])
        elif j == 0 and i > 0:  # p_i1
            p_ij_reconstructed[i, j] = p_ij_reconstructed[0, 0] * np.exp(theta_i[i - 1])
        elif i > 0 and j > 0:  # p_ij
            p_ij_reconstructed[i, j] = p_ij_reconstructed[0, 0] * np.exp(
                theta_i[i - 1] + phi_j[j - 1] + lambda_ij[i - 1, j - 1]
            )

# 3. 結果を確認
print("元の p_ij:")
print(p_ij)
print("\n再構成した p_ij:")
print(p_ij_reconstructed)

# 一致を確認
if np.allclose(p_ij, p_ij_reconstructed, atol=1e-10):
    print("\n与えられた p_ij と再構成した p_ij は一致しました!変換は一対一です。")
else:
    print("\n再構成した p_ij が元の p_ij と一致しません。")
元の p_ij:
[[0.2 0.1 0.05]
[0.15 0.25 0.05]
[0.05 0.05 0.1 ]]
再構成した p_ij:
[[0.2 0.1 0.05]
[0.15 0.25 0.05]
[0.05 0.05 0.1 ]]
与えられた p_ij と再構成した p_ij は一致しました!変換は一対一です。与えられたセル確率![]() と、再構成したセル確率
と、再構成したセル確率![]() は一致しました。このことから、変換が一対一であることが確認されました。
は一致しました。このことから、変換が一対一であることが確認されました。
2015 Q4(3)
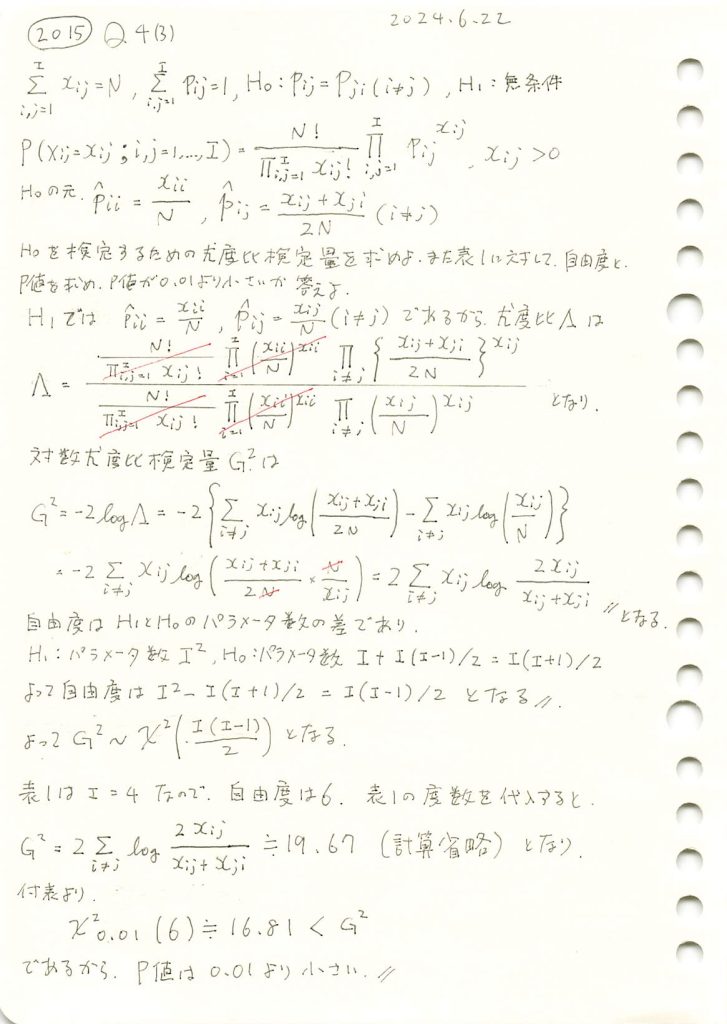
確率の分割表に対称性があるという仮説の下での尤度比検定を行いp値が0.01より小さいか判定しました。
コード
![]() が成り立つかを確認するために、尤度比検定量
が成り立つかを確認するために、尤度比検定量![]() を求め、尤度比検定を行います。
を求め、尤度比検定を行います。
# 2015 Q4(3)  2024.12.19

import numpy as np
from scipy.stats import chi2

# 観測度数表
observed_counts = np.array([[1520, 266, 124, 66],
                            [234, 1512, 432, 78],
                            [117, 362, 1772, 205],
                            [36, 82, 179, 492]])

I = observed_counts.shape[0]  # 行・列のサイズ

# 尤度比統計量 G^2 の計算 (対角要素を除外)
G2 = 2 * sum(
    observed_counts[i, j] * np.log(2 * observed_counts[i, j] / (observed_counts[i, j] + observed_counts[j, i]))
    for i in range(I) for j in range(I) if i != j
)

# 自由度の計算 (非対角要素の数: I(I-1)/2)
df = (I * (I - 1)) // 2

# P値の計算
p_value = 1 - chi2.cdf(G2, df)

# 結果の表示
print(f"尤度比統計量 G^2: {G2:.4f}")
print(f"自由度: {df}")
print(f"P値: {p_value:.10f}")

# 帰無仮説の判定
if p_value < 0.01:
    print("P値は0.01より小さいため、帰無仮説 H_0 は棄却されます。")
else:
    print("P値は0.01以上のため、帰無仮説 H_0 は棄却されません。")
尤度比統計量 G^2: 19.2492
自由度: 6
P値: 0.0037628518
P値は0.01より小さいため、帰無仮説 H_0 は棄却されます。
P値は0.01より小さいため、帰無仮説 ![]() は棄却されました。
は棄却されました。
2015 Q4(2)
確率の分割表に対称性があるという仮説の下での期待度数の最尤推定を行いました。
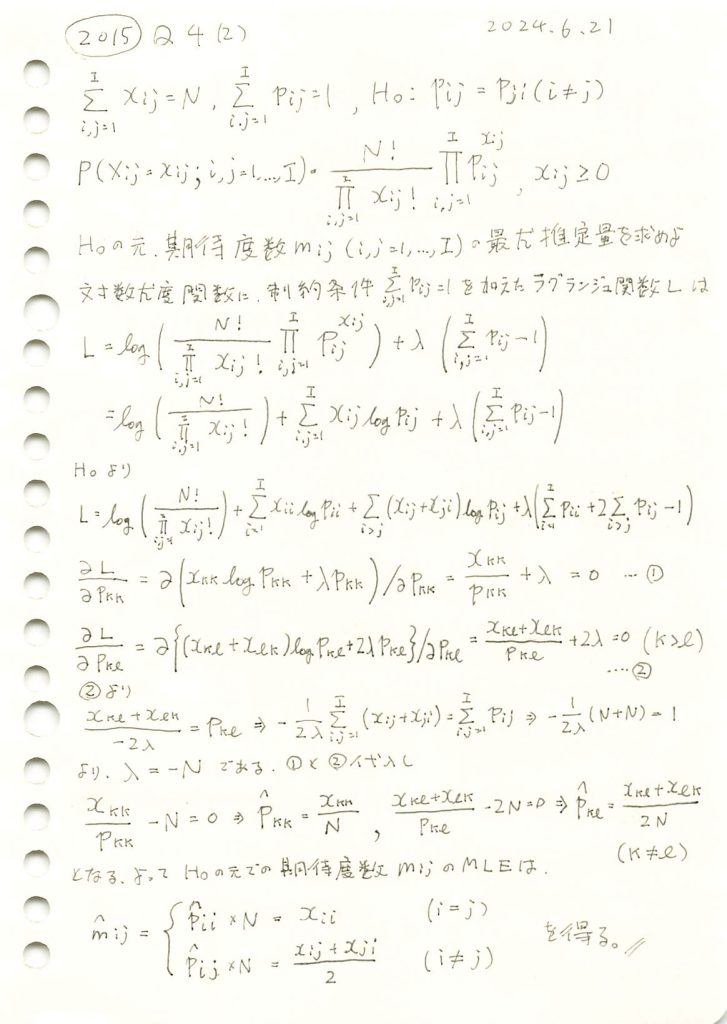
与えられた観測度数表から![]() に基づき期待度数を求めます。
に基づき期待度数を求めます。
# 2015 Q4(2)  2024.12.18

import numpy as np
import pandas as pd
import matplotlib.pyplot as plt
import seaborn as sns

# 1. 観測度数表
observed_counts = np.array([[1520, 266, 124, 66],
                            [234, 1512, 432, 78],
                            [117, 362, 1772, 205],
                            [36, 82, 179, 492]])

# 2. 総サンプルサイズ N
N = observed_counts.sum()

# 3. 期待度数 m_ij の計算 (対称性の仮説)
m_ij = np.zeros_like(observed_counts, dtype=float)
I = observed_counts.shape[0]

for i in range(I):
    for j in range(I):
        if i == j:  # 対角要素
            m_ij[i, j] = observed_counts[i, j]
        else:  # 非対角要素
            m_ij[i, j] = (observed_counts[i, j] + observed_counts[j, i]) / 2

# 4. 観測度数と期待度数をDataFrameにまとめる
row_labels = col_labels = ["Highest", "Second", "Third", "Lowest"]
df_observed = pd.DataFrame(observed_counts, index=row_labels, columns=col_labels)
df_expected = pd.DataFrame(np.round(m_ij, 2), index=row_labels, columns=col_labels)

# 5. 観測度数と期待度数のヒートマップを作成
fig, axes = plt.subplots(1, 2, figsize=(12, 6))

# 観測度数のヒートマップ
sns.heatmap(df_observed, annot=True, fmt=".0f", cmap="Blues", ax=axes[0])
axes[0].set_title("観測度数表 $x_{ij}$")

# 期待度数のヒートマップ
sns.heatmap(df_expected, annot=True, fmt=".2f", cmap="Greens", ax=axes[1])
axes[1].set_title("期待度数表 $\hat{m}_{ij}$ (対称性の仮説)")

plt.tight_layout()
plt.show()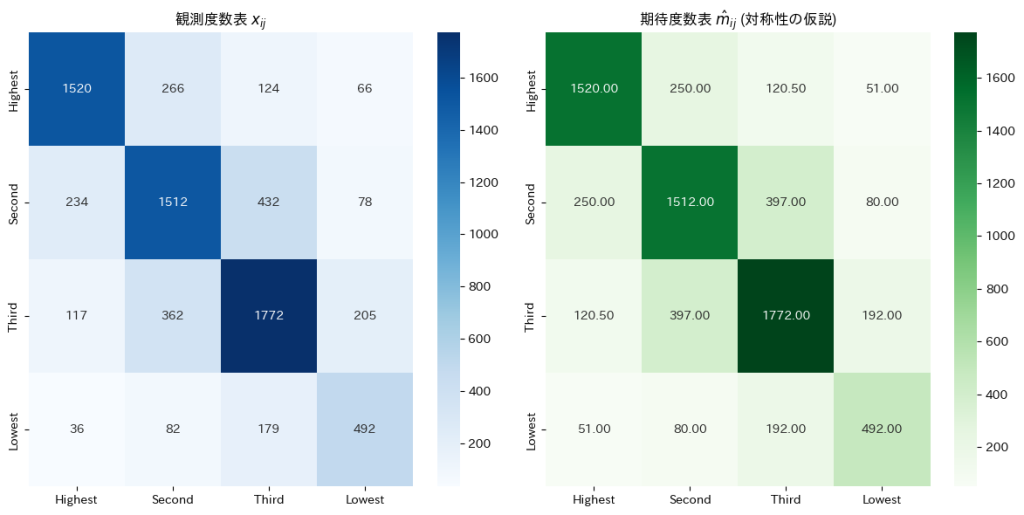
与えられた観測度数表から![]() に基づいて期待度数を求めると、非対角要素は対応する2つの観測度数の平均として表され、対角要素は観測度数そのものが期待度数となりました。
に基づいて期待度数を求めると、非対角要素は対応する2つの観測度数の平均として表され、対角要素は観測度数そのものが期待度数となりました。