ホーム » 平均二乗誤差MSE
「平均二乗誤差MSE」カテゴリーアーカイブ
2014 Q4(5)
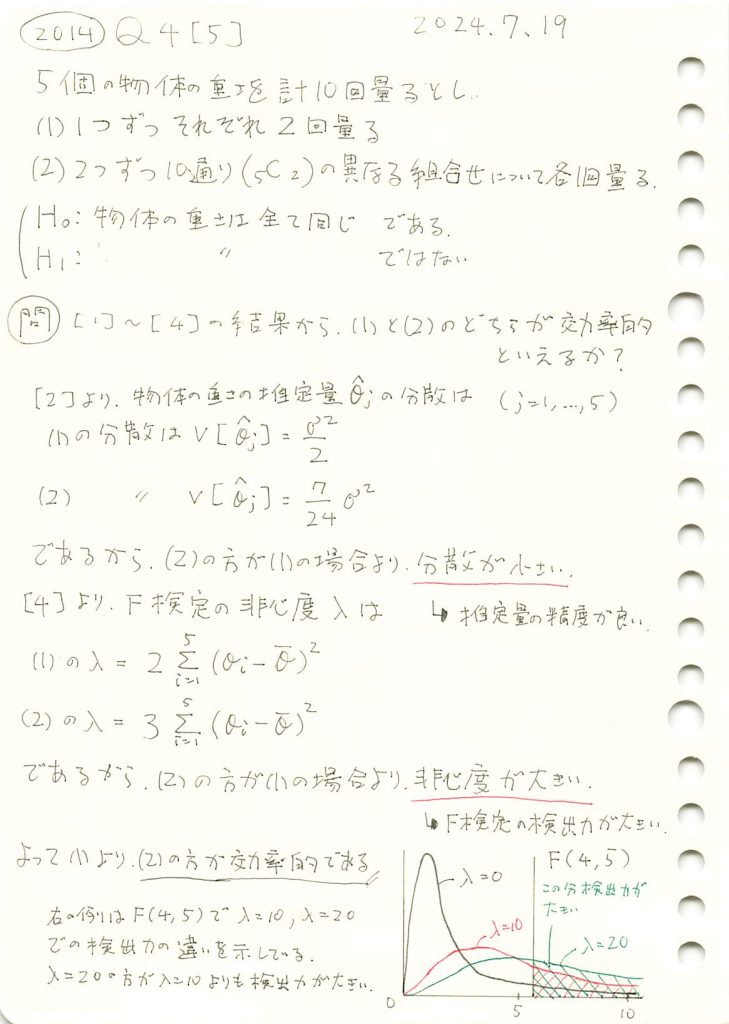
5個の物体の重さを、1つずつ2回量る場合と、2つずつ10通り量る場合で、物体の重さが全て同じか、そうでないかF検定するとき、どちらの場合が効率的かを示しました。
コード
(1)の計画行列X1と、(2)の計画行列X2を、それぞれ0と1を反転させた計画行列X3,X4を加え、それぞれの分散と非心度λを計算して比較してみます。
# 2014 Q4(5)  2025.1.14

import numpy as np

# 設計行列 (1)~(4)
X1 = np.array([
    [1, 0, 0, 0, 0],
    [1, 0, 0, 0, 0],
    [0, 1, 0, 0, 0],
    [0, 1, 0, 0, 0],
    [0, 0, 1, 0, 0],
    [0, 0, 1, 0, 0],
    [0, 0, 0, 1, 0],
    [0, 0, 0, 1, 0],
    [0, 0, 0, 0, 1],
    [0, 0, 0, 0, 1]
])

X2 = np.array([
    [1, 1, 0, 0, 0],
    [1, 0, 1, 0, 0],
    [1, 0, 0, 1, 0],
    [1, 0, 0, 0, 1],
    [0, 1, 1, 0, 0],
    [0, 1, 0, 1, 0],
    [0, 1, 0, 0, 1],
    [0, 0, 1, 1, 0],
    [0, 0, 1, 0, 1],
    [0, 0, 0, 1, 1]
])

X3 = 1 - X2  # (2) の反転
X4 = 1 - X1  # (1) の反転

# 設計行列リスト
design_matrices = [X1, X2, X3, X4]

# 真の値 θ
true_theta = np.array([10, 20, 30, 40, 50])

# 結果を格納するリスト
results = []

for i, X in enumerate(design_matrices, start=1):
    # 分散行列を計算
    variance_matrix = np.linalg.inv(X.T @ X)
    # 平均分散を計算
    mean_variance = np.trace(variance_matrix) / len(variance_matrix)

    # 非心度 λ を計算
    theta_mean = np.mean(true_theta)
    ones_vector = np.ones((X.shape[0], 1))  # X の行数に応じた列ベクトル
    theta_centered = true_theta - theta_mean  # θ から平均を引いたベクトル
    numerator = theta_centered.T @ X.T @ X @ theta_centered
    denominator = ones_vector.T @ X @ X.T @ ones_vector
    non_centrality_lambda = numerator.item()  # スカラーに変換

    # 結果を保存
    results.append((i, mean_variance, non_centrality_lambda))

# 結果の出力
for i, mean_variance, non_centrality_lambda in results:
    print(f"(X{i}) の平均分散: {mean_variance:.6f}, 非心度 λ: {non_centrality_lambda:.6f}")
(X1) の平均分散: 0.500000, 非心度 λ: 2000.000000
(X2) の平均分散: 0.291667, 非心度 λ: 3000.000000
(X3) の平均分散: 0.277778, 非心度 λ: 3000.000000
(X4) の平均分散: 0.406250, 非心度 λ: 2000.000000(2)の計画行列X2は、(1)の計画行列X1に比べ、平均分散が小さく、非心度 λが大きいため、より優れた計画行列と言えます。また、X2の0と1を反転したX3は、X2よりも分散がさらに小さく、非心度 λが変化しないことから、この中で最も優れた計画行列と考えられます。
X3 = np.array([
    [0, 0, 1, 1, 1],
    [0, 1, 0, 1, 1],
    [0, 1, 1, 0, 1],
    [0, 1, 1, 1, 0],
    [1, 0, 0, 1, 1],
    [1, 0, 1, 0, 1],
    [1, 0, 1, 1, 0],
    [1, 1, 0, 0, 1],
    [1, 1, 0, 1, 0],
    [1, 1, 1, 0, 0]
])
2014 Q4(4)
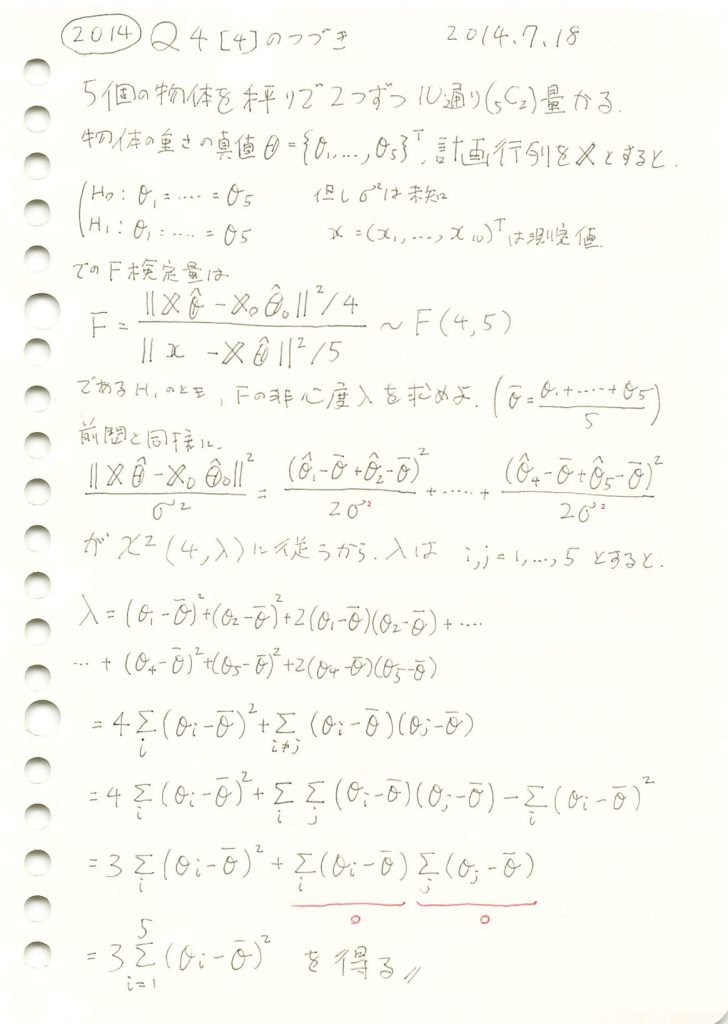
5個の物体の重さを2つずつ10通り量る場合で、誤差の分散を未知とし、全ての物体の重さが等しいとはいえないとする対立仮説のF検定量の非心度を求めました。
コード
真の値![]() から
から![]() へ徐々に変化させて、非心度λを計算し、その変化をグラフにプロットしてみます。測定法(1)と測定法(2)を同時に表示し、分散の違いを確認してみます。
へ徐々に変化させて、非心度λを計算し、その変化をグラフにプロットしてみます。測定法(1)と測定法(2)を同時に表示し、分散の違いを確認してみます。
# 2014 Q4(4)  2025.1.13

import numpy as np
import matplotlib.pyplot as plt

# 初期設定
theta_initial = np.array([10, 10, 10, 10, 10])  # 初期の真の値
theta_final = np.array([10, 20, 30, 40, 50])  # 最終的な真の値
steps = 50  # 変化のステップ数

# θを徐々に変化させる
theta_values = [theta_initial + (theta_final - theta_initial) * t / steps for t in range(steps + 1)]

# 非心度 λ を計算
# 測定法(1): 係数は2
lambdas_1 = [2 * np.sum((theta - np.mean(theta)) ** 2) for theta in theta_values]
# 測定法(2): 係数は3
lambdas_2 = [3 * np.sum((theta - np.mean(theta)) ** 2) for theta in theta_values]

# サンプルのインデックス(途中でいくつかの点を表示)
sample_indices = [0, 10, 20, 30, 40, 50]

# 真の値と対応する λ を取得 (測定法(1) と測定法(2))
sample_theta_values = [theta_values[i] for i in sample_indices]
sample_lambdas_1 = [lambdas_1[i] for i in sample_indices]
sample_lambdas_2 = [lambdas_2[i] for i in sample_indices]

# 視覚化
plt.figure(figsize=(12, 8))

# 測定法(1) のプロット
plt.plot(range(steps + 1), lambdas_1, label="測定法(1): λ", color="blue")
plt.scatter(sample_indices, sample_lambdas_1, color="blue", label="測定法(1) サンプル点")
for i, (theta, lam) in enumerate(zip(sample_theta_values, sample_lambdas_1)):
    plt.text(sample_indices[i], lam, f"{np.round(theta, 1)}\nλ={lam:.1f}",
             fontsize=10, ha="center", color="blue")

# 測定法(2) のプロット
plt.plot(range(steps + 1), lambdas_2, label="測定法(2): λ", color="red")
plt.scatter(sample_indices, sample_lambdas_2, color="red", label="測定法(2) サンプル点")
for i, (theta, lam) in enumerate(zip(sample_theta_values, sample_lambdas_2)):
    plt.text(sample_indices[i], lam, f"{np.round(theta, 1)}\nλ={lam:.1f}",
             fontsize=10, ha="center", color="red")

# グラフの設定
plt.xlabel("変化のステップ数")
plt.ylabel("非心度 λ")
plt.title("真の値の変化による非心度 λ の変化 (測定法(1) と 測定法(2))")
plt.legend()
plt.grid()
plt.show()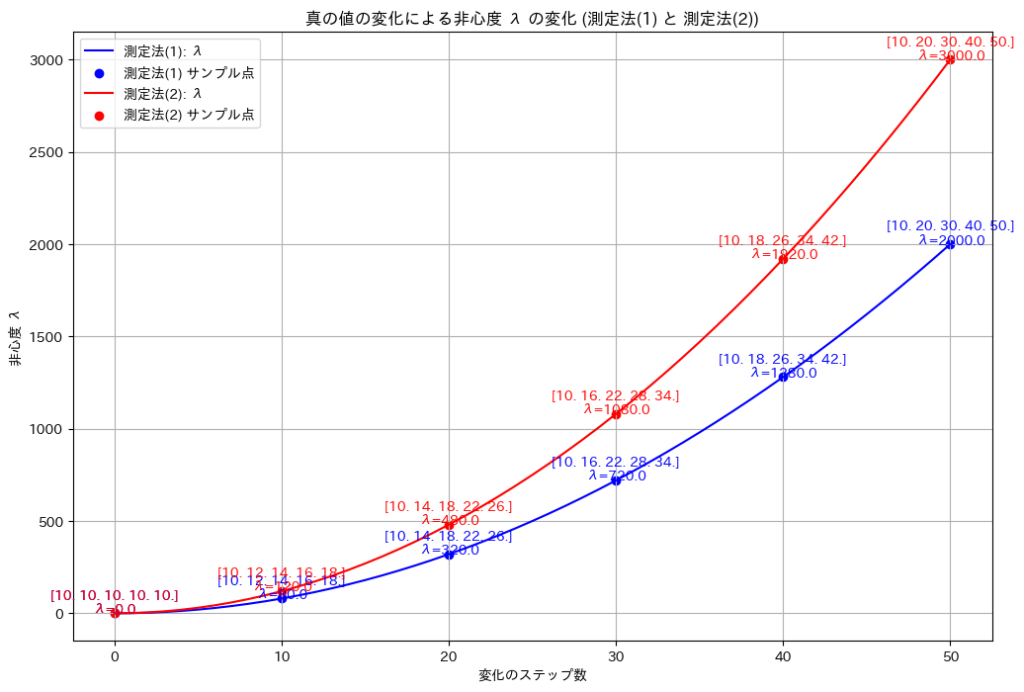
真の値![]() のばらつきが大きくなるにつれて、非心度λも非線形的に増加することが確認できました。また測定法(1)のほうが測定法(2)より分散が大きいことが確認できました。
のばらつきが大きくなるにつれて、非心度λも非線形的に増加することが確認できました。また測定法(1)のほうが測定法(2)より分散が大きいことが確認できました。
2014 Q4(4)
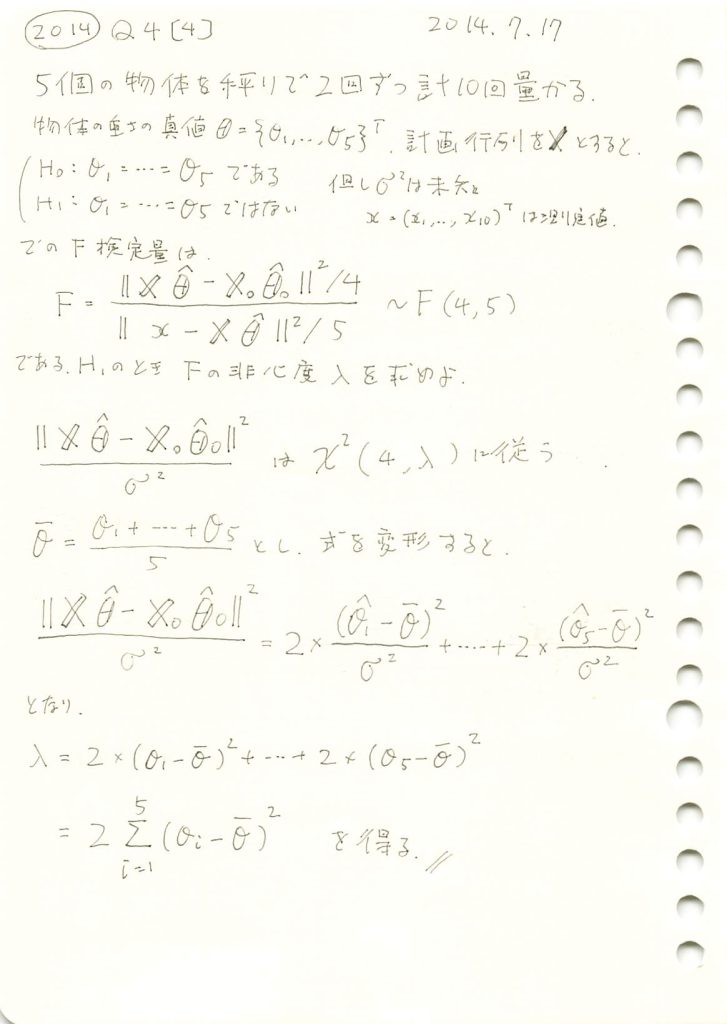
5個の物体の重さを1つずつ2回量る場合で、誤差の分散を未知とし、全ての物体の重さが等しいとはいえないとする対立仮説のF検定量の非心度を求めました。
コード
真の値![]() から
から![]() へ徐々に変化させて、非心度λを計算し、その変化をグラフにプロットしてみます。
へ徐々に変化させて、非心度λを計算し、その変化をグラフにプロットしてみます。
# 2014 Q4(4)  2025.1.12

import numpy as np
import matplotlib.pyplot as plt

# 初期設定
theta_initial = np.array([10, 10, 10, 10, 10])  # 初期の真の値
theta_final = np.array([10, 20, 30, 40, 50])  # 最終的な真の値
steps = 50  # 変化のステップ数

# θを徐々に変化させる
theta_values = [theta_initial + (theta_final - theta_initial) * t / steps for t in range(steps + 1)]

# 非心度 λ を計算 (測定法(1): 係数は2)
lambdas_1 = [2 * np.sum((theta - np.mean(theta)) ** 2) for theta in theta_values]

# サンプルのインデックス(途中でいくつかの点を表示)
sample_indices = [0, 10, 20, 30, 40, 50]

# 真の値と対応する λ を取得 (測定法(1))
sample_theta_values = [theta_values[i] for i in sample_indices]
sample_lambdas_1 = [lambdas_1[i] for i in sample_indices]

# 視覚化
plt.figure(figsize=(10, 6))
plt.plot(range(steps + 1), lambdas_1, label="測定法(1): λ", color="blue")
plt.scatter(sample_indices, sample_lambdas_1, color="red", label="サンプル点")
for i, (theta, lam) in enumerate(zip(sample_theta_values, sample_lambdas_1)):
    plt.text(sample_indices[i], lam, f"{np.round(theta, 1)}\nλ={lam:.1f}",
             fontsize=10, ha="center", color="blue")

# グラフの設定
plt.xlabel("変化のステップ数")
plt.ylabel("非心度 λ")
plt.title("真の値の変化による非心度 λ の変化 (測定法(1))")
plt.legend()
plt.grid()
plt.show()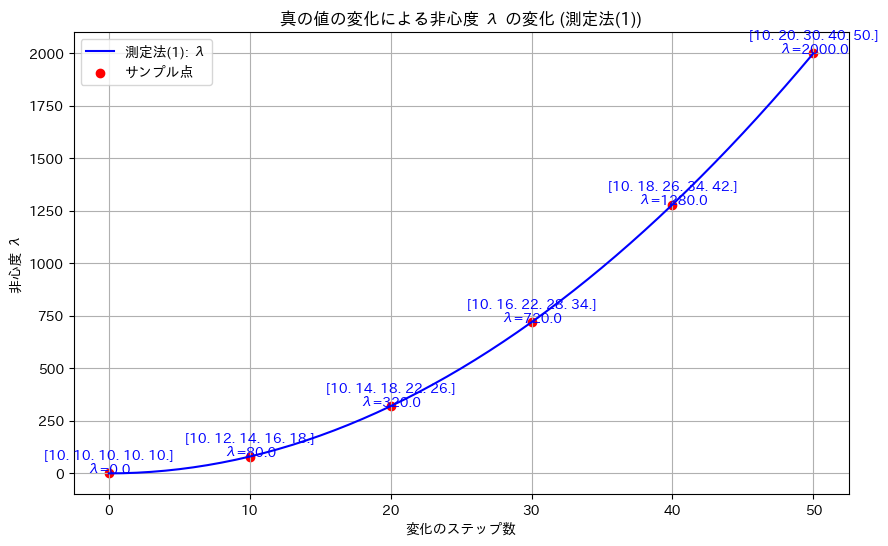
真の値![]() のばらつきが大きくなるにつれて、非心度λも非線形的に増加することが確認できました。
のばらつきが大きくなるにつれて、非心度λも非線形的に増加することが確認できました。
2014 Q4(3)
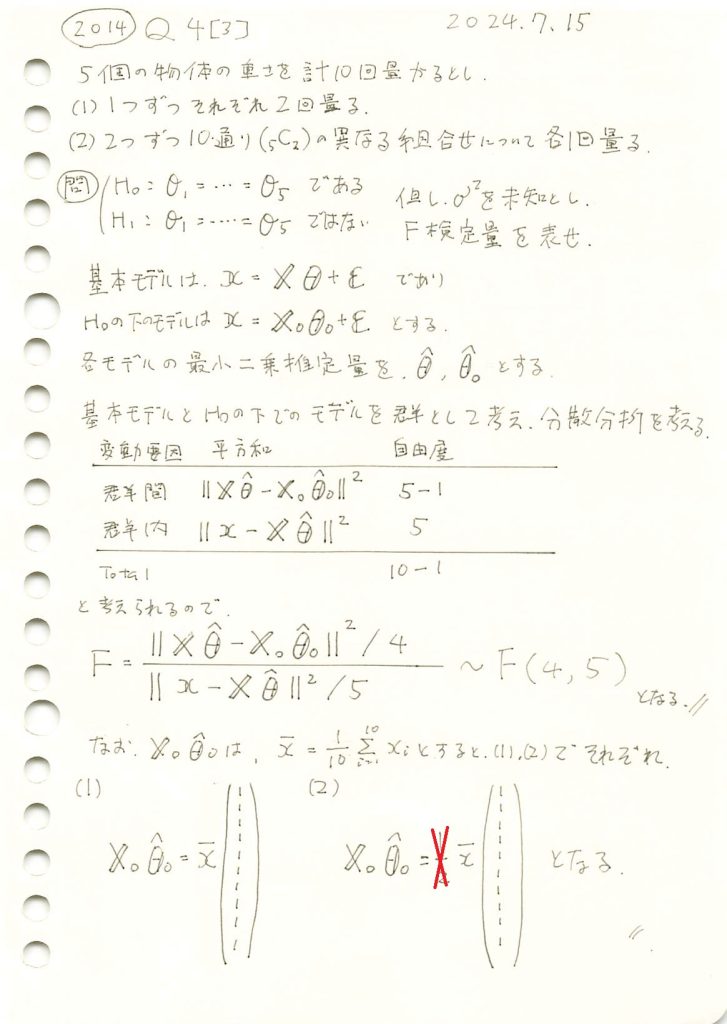
5個の物体の重さを、1つずつ2回量る場合と、2つずつ10通り量る場合で、誤差の分散を未知とし、全ての物体の重さが等しいとする帰無仮説を検定するF検定量を求めました。
コード
真の値![]() とし、二つの測定方法(1)と(2)においてシミュレーションを行い、F統計量を計算して、帰無仮説H0が棄却されるかを検定を行います。
とし、二つの測定方法(1)と(2)においてシミュレーションを行い、F統計量を計算して、帰無仮説H0が棄却されるかを検定を行います。
# 2014 Q4(3)  2025.1.11

import numpy as np
from scipy.stats import f

# パラメータ設定
n = 10  # 観測データ数
p_1 = 5  # 自由度(対立仮説モデルのパラメータ数)
p_0 = 1  # 自由度(帰無仮説モデルのパラメータ数)
nu_1 = p_1 - p_0  # 分子の自由度
nu_2 = n - p_1  # 分母の自由度

# 設計行列
X1 = np.array([  # 測定法 (1)
    [1, 0, 0, 0, 0],
    [1, 0, 0, 0, 0],
    [0, 1, 0, 0, 0],
    [0, 1, 0, 0, 0],
    [0, 0, 1, 0, 0],
    [0, 0, 1, 0, 0],
    [0, 0, 0, 1, 0],
    [0, 0, 0, 1, 0],
    [0, 0, 0, 0, 1],
    [0, 0, 0, 0, 1]
])

X2 = np.array([  # 測定法 (2)
    [1, 1, 0, 0, 0],
    [1, 0, 1, 0, 0],
    [1, 0, 0, 1, 0],
    [1, 0, 0, 0, 1],
    [0, 1, 1, 0, 0],
    [0, 1, 0, 1, 0],
    [0, 1, 0, 0, 1],
    [0, 0, 1, 1, 0],
    [0, 0, 1, 0, 1],
    [0, 0, 0, 1, 1]
])

X0 = np.ones((n, 1))  # 帰無仮説モデルの設計行列

# シミュレーション設定
true_theta = np.array([10, 10, 10, 10, 10])  # 真の値 (帰無仮説下)
sigma_squared = 1  # 誤差分散
n_simulations = 10000  # シミュレーション回数

# 統計量を保存するリスト
f_statistics_1 = []
f_statistics_2 = []

# シミュレーション
for _ in range(n_simulations):
    # 観測データ生成
    epsilon = np.random.normal(0, np.sqrt(sigma_squared), n)
    x1 = X1 @ true_theta + epsilon
    x2 = X2 @ true_theta + epsilon

    # 最小二乗推定量
    theta_hat_1 = np.linalg.inv(X1.T @ X1) @ X1.T @ x1
    theta_hat_2 = np.linalg.inv(X2.T @ X2) @ X2.T @ x2
    theta_hat_0_1 = np.linalg.inv(X0.T @ X0) @ X0.T @ x1
    theta_hat_0_2 = np.linalg.inv(X0.T @ X0) @ X0.T @ x2

    # 分子と分母の計算
    numerator_1 = np.sum((X1 @ theta_hat_1 - X0 @ theta_hat_0_1) ** 2) / nu_1
    denominator_1 = np.sum((x1 - X1 @ theta_hat_1) ** 2) / nu_2
    f_stat_1 = numerator_1 / denominator_1

    numerator_2 = np.sum((X2 @ theta_hat_2 - X0 @ theta_hat_0_2) ** 2) / nu_1
    denominator_2 = np.sum((x2 - X2 @ theta_hat_2) ** 2) / nu_2
    f_stat_2 = numerator_2 / denominator_2

    f_statistics_1.append(f_stat_1)
    f_statistics_2.append(f_stat_2)

# 平均 F 統計量を計算
f_stat_mean_1 = np.mean(f_statistics_1)
f_stat_mean_2 = np.mean(f_statistics_2)

# 理論 F 分布の平均計算
f_theoretical_mean = nu_2 / (nu_2 - 2) if nu_2 > 2 else None

# P値の計算
p_value_1 = 1 - f.cdf(f_stat_mean_1, nu_1, nu_2)
p_value_2 = 1 - f.cdf(f_stat_mean_2, nu_1, nu_2)

# 有意水準
alpha = 0.05
reject_null_1 = p_value_1 < alpha
reject_null_2 = p_value_2 < alpha

# 結果を出力
print("理論 F 分布の平均 (自由度 ν1 = {0}, ν2 = {1}): {2:.4f}".format(nu_1, nu_2, f_theoretical_mean))

print("\n測定法 (1):")
print("  平均 F 統計量: {:.4f}".format(f_stat_mean_1))
print("  P値: {:.4e}".format(p_value_1))
print("  帰無仮説を棄却するか: {}".format("はい" if reject_null_1 else "いいえ"))

print("\n測定法 (2):")
print("  平均 F 統計量: {:.4f}".format(f_stat_mean_2))
print("  P値: {:.4e}".format(p_value_2))
print("  帰無仮説を棄却するか: {}".format("はい" if reject_null_2 else "いいえ"))
理論 F 分布の平均 (自由度 ν1 = 4, ν2 = 5): 1.6667
測定法 (1):
平均 F 統計量: 1.6255
P値: 3.0067e-01
帰無仮説を棄却するか: いいえ
測定法 (2):
平均 F 統計量: 1.6490
P値: 2.9569e-01
帰無仮説を棄却するか: いいえ二つの測定方法(1)と(2)においてシミュレーションを行い、F検定の結果、どちらの場合も帰無仮説H0が棄却されませんでした。
2014 Q4(2)
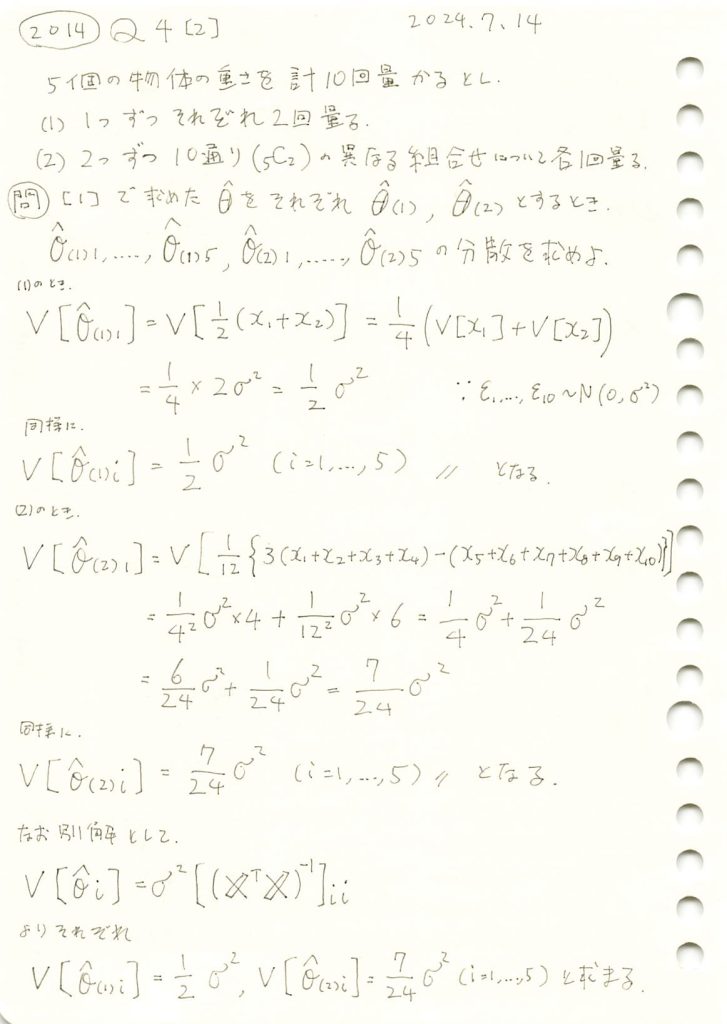
5個の物体の重さを、1つずつ2回量る場合と、2つずつ10通り量る場合で得た最小二乗法による各物体の重さの推定値の分散を求めました。
コード
シミュレーションにより、推定量![]() の分散を求め、理論分散と比較してみます。
の分散を求め、理論分散と比較してみます。
# 2014 Q4(2)  2025.1.10

import numpy as np

# シミュレーション設定
np.random.seed(42)  # 再現性のための乱数シード
n_simulations = 10000  # シミュレーション回数
sigma_squared = 1  # 誤差分散
true_theta = np.array([10, 20, 30, 40, 50])  # 真の値 (任意設定)

# (1) 各物体を2回測定する場合
X1 = np.array([
    [1, 0, 0, 0, 0],
    [1, 0, 0, 0, 0],
    [0, 1, 0, 0, 0],
    [0, 1, 0, 0, 0],
    [0, 0, 1, 0, 0],
    [0, 0, 1, 0, 0],
    [0, 0, 0, 1, 0],
    [0, 0, 0, 1, 0],
    [0, 0, 0, 0, 1],
    [0, 0, 0, 0, 1]
])

# (2) 2つずつ異なる組み合わせで測定する場合
X2 = np.array([
    [1, 1, 0, 0, 0],
    [1, 0, 1, 0, 0],
    [1, 0, 0, 1, 0],
    [1, 0, 0, 0, 1],
    [0, 1, 1, 0, 0],
    [0, 1, 0, 1, 0],
    [0, 1, 0, 0, 1],
    [0, 0, 1, 1, 0],
    [0, 0, 1, 0, 1],
    [0, 0, 0, 1, 1]
])

# 理論分散
theoretical_variance_1 = sigma_squared / 2
theoretical_variance_2 = 7 * sigma_squared / 24

# シミュレーション結果を格納するリスト
variances_1 = []
variances_2 = []

for _ in range(n_simulations):
    # 誤差を生成
    epsilon = np.random.normal(0, np.sqrt(sigma_squared), 10)

    # 測定値を生成
    x1 = X1 @ true_theta + epsilon  # (1) の場合
    x2 = X2 @ true_theta + epsilon  # (2) の場合

    # 最小二乗推定量を計算
    theta_hat_1 = np.linalg.inv(X1.T @ X1) @ X1.T @ x1
    theta_hat_2 = np.linalg.inv(X2.T @ X2) @ X2.T @ x2

    # 推定量の分散を計算
    variances_1.append(np.mean((theta_hat_1 - true_theta)**2))
    variances_2.append(np.mean((theta_hat_2 - true_theta)**2))

# シミュレーション結果の平均
simulated_variance_1 = np.mean(variances_1)
simulated_variance_2 = np.mean(variances_2)

# 結果の出力
print("(1) 理論分散:", theoretical_variance_1)
print("(1) シミュレーション分散:", simulated_variance_1)
print("(2) 理論分散:", theoretical_variance_2)
print("(2) シミュレーション分散:", simulated_variance_2)
(1) 理論分散: 0.5
(1) シミュレーション分散: 0.5003499949049185
(2) 理論分散: 0.2916666666666667
(2) シミュレーション分散: 0.2926572303618685シミュレーションによる推定量![]() の分散は、理論分散とよく一致しました。
の分散は、理論分散とよく一致しました。
2014 Q4(1)-2
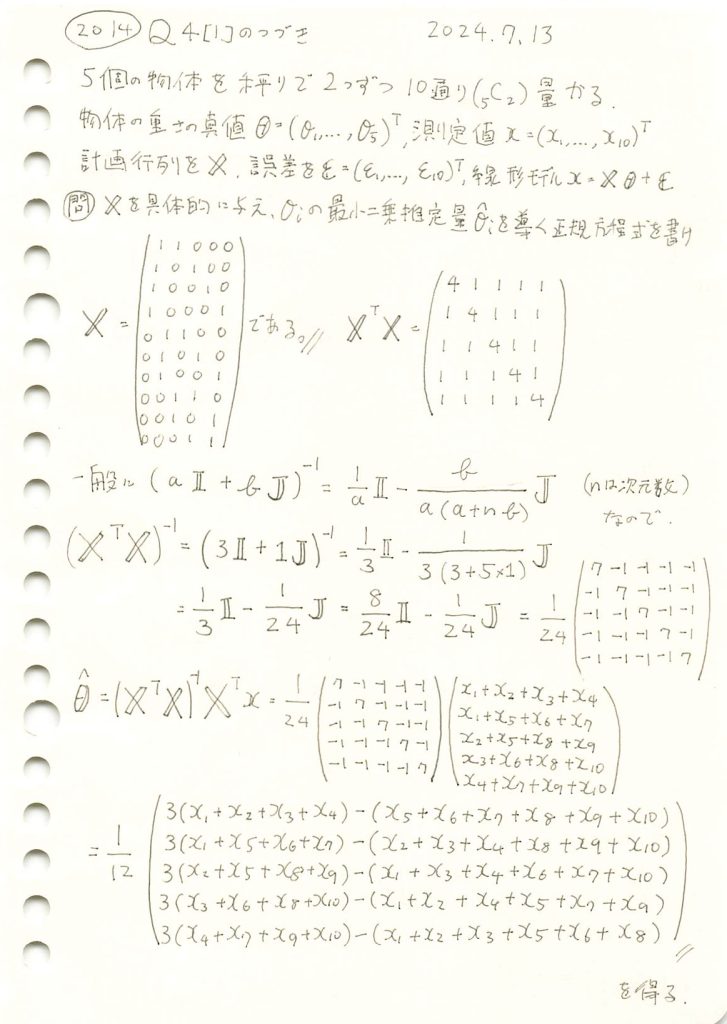
5個の物体の重さを、2つずつ10通り量る場合で、最小二乗法による各物体の重さの推定量を求めました。
コード
最小二乗推定量![]() に基づいて計算してみます。
に基づいて計算してみます。
# 2014 Q4(1)-2  2025.1.9

import numpy as np

# 測定値
x = np.array([10.1, 12.3, 13.5, 14.6, 9.8, 11.7, 15.3, 12.8, 13.1, 14.2])

# 設計行列 X を構築 (2つずつ異なる組み合わせで10通り測定)
X = np.array([
    [1, 1, 0, 0, 0],
    [1, 0, 1, 0, 0],
    [1, 0, 0, 1, 0],
    [1, 0, 0, 0, 1],
    [0, 1, 1, 0, 0],
    [0, 1, 0, 1, 0],
    [0, 1, 0, 0, 1],
    [0, 0, 1, 1, 0],
    [0, 0, 1, 0, 1],
    [0, 0, 0, 1, 1]
])

# 最小二乗推定量の計算
X_transpose = X.T
theta_hat = np.linalg.inv(X_transpose @ X) @ X_transpose @ x

# 結果を出力
print("最小二乗推定量 (θ̂):", theta_hat)
最小二乗推定量 (θ̂): [6.21666667 5.01666667 5.38333333 6.78333333 8.45 ]最小二乗推定量![]() が計算されました。
が計算されました。
次に、手計算で導いた式に基づいて計算してみます。
# 2014 Q4(1)-2  2025.1.9

import numpy as np

# 測定値
x = np.array([10.1, 12.3, 13.5, 14.6, 9.8, 11.7, 15.3, 12.8, 13.1, 14.2])

# θ^ を問題で導いた式に基づいて計算
theta_hat = np.array([
    (3 * (x[0] + x[1] + x[2] + x[3]) - (x[4] + x[5] + x[6] + x[7] + x[8] + x[9])) / 12,
    (3 * (x[0] + x[4] + x[5] + x[6]) - (x[1] + x[2] + x[3] + x[7] + x[8] + x[9])) / 12,
    (3 * (x[1] + x[4] + x[7] + x[8]) - (x[0] + x[2] + x[3] + x[5] + x[6] + x[9])) / 12,
    (3 * (x[2] + x[5] + x[7] + x[9]) - (x[0] + x[1] + x[3] + x[4] + x[6] + x[8])) / 12,
    (3 * (x[3] + x[6] + x[8] + x[9]) - (x[0] + x[1] + x[2] + x[4] + x[5] + x[7])) / 12
])

# 結果を出力
print("最小二乗推定量 (θ̂):", theta_hat)
最小二乗推定量 (θ̂): [6.21666667 5.01666667 5.38333333 6.78333333 8.45 ]最小二乗推定量![]() が計算され、
が計算され、![]() で計算された値と一致しました。
で計算された値と一致しました。
2014 Q4(1)-1
5個の物体の重さを、1つずつ2回量る場合で、最小二乗法による各物体の重さの推定量を求めました。
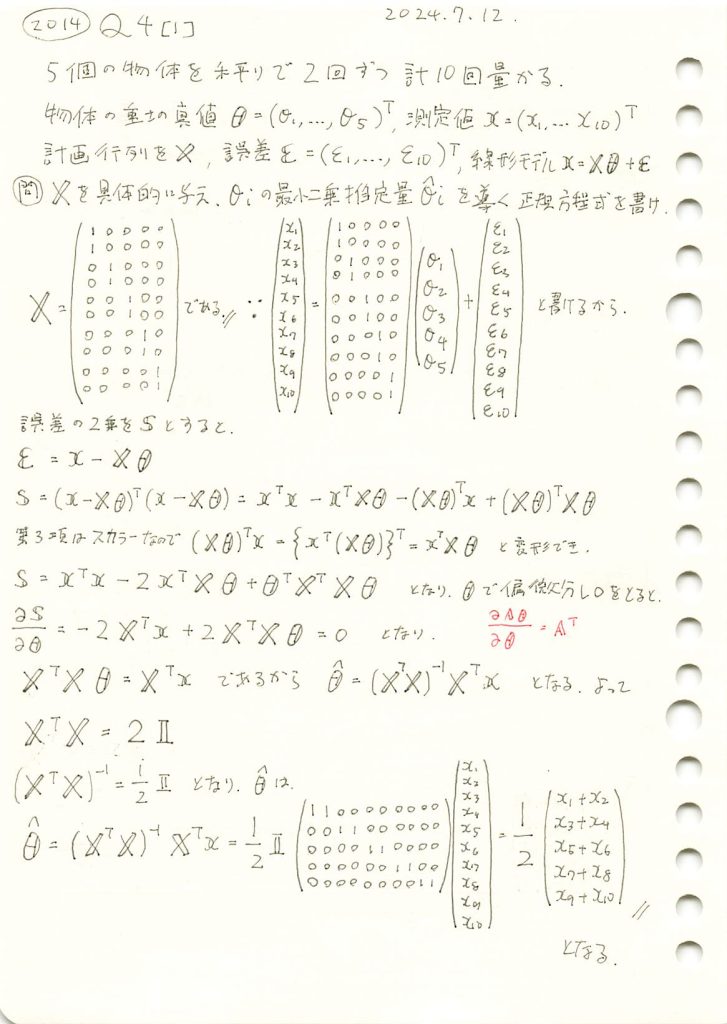
コード
最小二乗推定量![]() に基づいて計算してみます。
に基づいて計算してみます。
# 2014 Q4(1)-1  2025.1.8

import numpy as np

# 測定値
x = np.array([5.1, 5.2, 7.3, 7.2, 6.8, 6.7, 4.9, 4.8, 5.5, 5.4])

# 設計行列 X を構築 (各物体を2回測定)
X = np.array([
    [1, 0, 0, 0, 0],
    [1, 0, 0, 0, 0],
    [0, 1, 0, 0, 0],
    [0, 1, 0, 0, 0],
    [0, 0, 1, 0, 0],
    [0, 0, 1, 0, 0],
    [0, 0, 0, 1, 0],
    [0, 0, 0, 1, 0],
    [0, 0, 0, 0, 1],
    [0, 0, 0, 0, 1]
])

# 最小二乗推定量の計算
X_transpose = X.T
theta_hat = np.linalg.inv(X_transpose @ X) @ X_transpose @ x

# 結果を出力
print("最小二乗推定量 (θ̂):", theta_hat)
最小二乗推定量 (θ̂): [5.15 7.25 6.75 4.85 5.45]最小二乗推定量![]() が計算されました。
が計算されました。
次に、手計算で導いた式に基づいて計算してみます。
# 2014 Q4(1)-1  2025.1.8

import numpy as np

# 測定値
x = np.array([5.1, 5.2, 7.3, 7.2, 6.8, 6.7, 4.9, 4.8, 5.5, 5.4])

# θ^ を手計算の式に基づいて計算
theta_hat = np.array([
    (x[0] + x[1]) / 2,
    (x[2] + x[3]) / 2,
    (x[4] + x[5]) / 2,
    (x[6] + x[7]) / 2,
    (x[8] + x[9]) / 2
])

# 結果を出力
print("最小二乗推定量 (θ̂):", theta_hat)
最小二乗推定量 (θ̂): [5.15 7.25 6.75 4.85 5.45]最小二乗推定量![]() が計算され、
が計算され、![]() で計算された値と一致しました。
で計算された値と一致しました。
2015 Q1(5)
不偏分散の定数C倍を母分散の推定量とし平均二乗誤差を最小とするCを求めました。
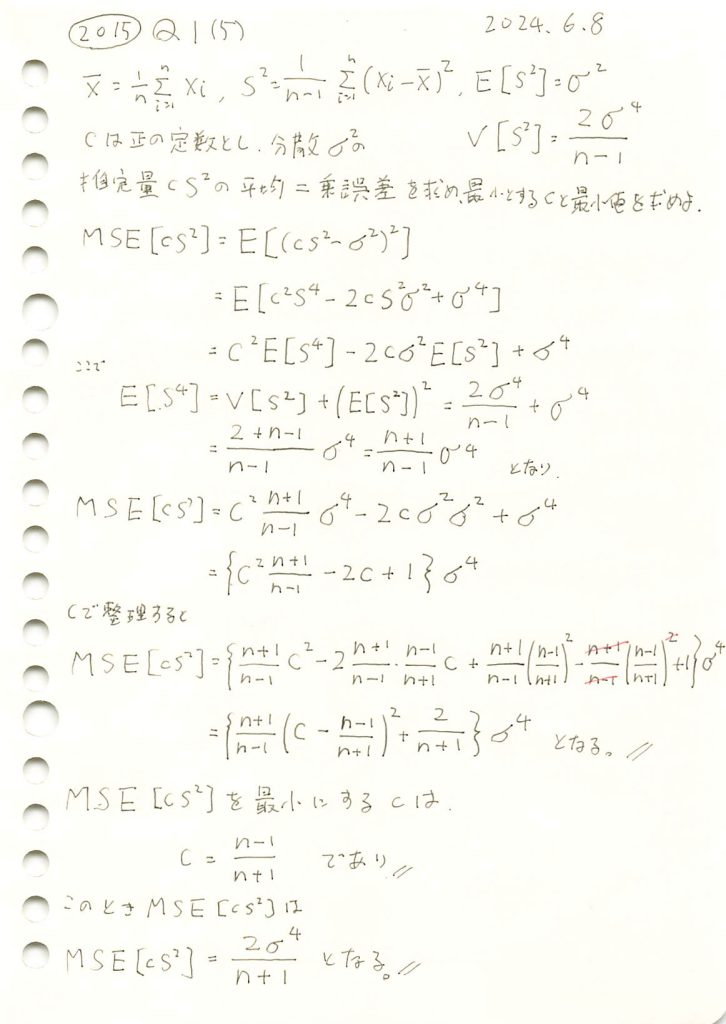
コード
![]() を最小にするcが
を最小にするcが![]() であるか確認するため、シミュレーションを行います。n=20の場合において、c≒0.9がMSEの最小になることを検証します。
であるか確認するため、シミュレーションを行います。n=20の場合において、c≒0.9がMSEの最小になることを検証します。
# 2015 Q1(5)  2024.12.6

import numpy as np
import matplotlib.pyplot as plt

# パラメータ設定
sigma2 = 4  # 母分散
sigma = np.sqrt(sigma2)  # 母標準偏差
n = 20  # 標本サイズ
num_simulations = 1000  # シミュレーション回数

# 理論値計算
c_theoretical = (n - 1) / (n + 1)  # 理論的に最適な c
mse_theoretical_min = sigma2**2 * (2 / (n + 1))  # 最小 MSE の理論値

# シミュレーションで MSE を計算
c_values = np.linspace(0.5, 1.5, 100)  # c をいろいろ変化させる
mse_simulated = []

for c in c_values:
    simulated_errors = []
    for _ in range(num_simulations):
        sample = np.random.normal(0, sigma, n)
        s2 = np.var(sample, ddof=1)  # 不偏分散
        error = (c * s2 - sigma2) ** 2  # 誤差の二乗
        simulated_errors.append(error)
    mse_simulated.append(np.mean(simulated_errors))

# グラフを描画
plt.figure(figsize=(10, 6))
plt.plot(c_values, mse_simulated, label="シミュレーションによる MSE", color='blue')
plt.axvline(c_theoretical, color='orange', linestyle='--', label=f"理論的な c={c_theoretical:.2f}")
plt.axhline(mse_theoretical_min, color='green', linestyle='--', label=f"最小理論 MSE={mse_theoretical_min:.2f}")
plt.title("MSE のシミュレーションと理論値")
plt.xlabel("c の値")
plt.ylabel("MSE")
plt.legend()
plt.grid()
plt.tight_layout()
plt.show()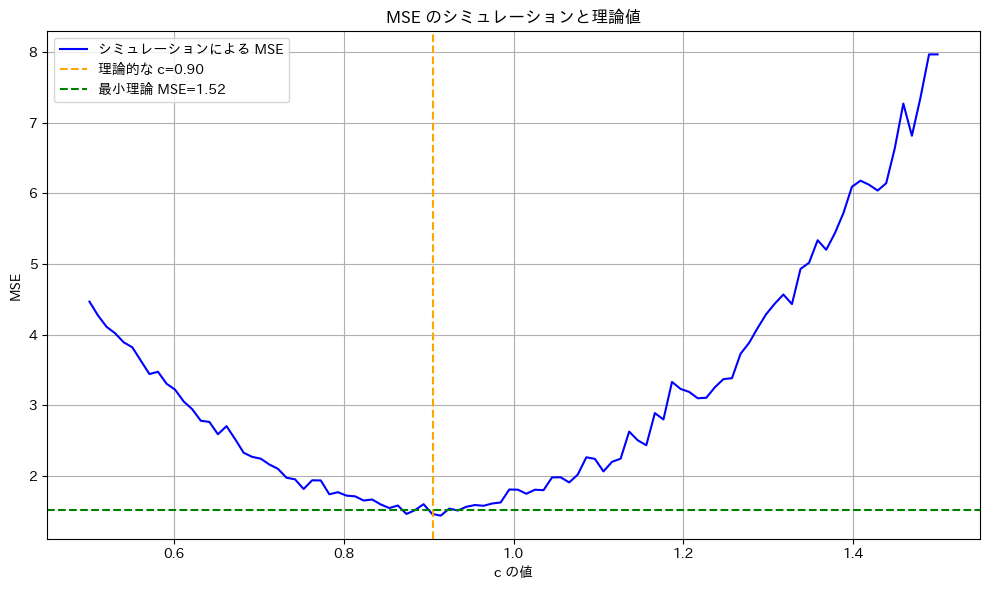
![]() は、n=20の場合において、理論通りc≒0.9のとき最小になることが確認されました。
は、n=20の場合において、理論通りc≒0.9のとき最小になることが確認されました。
2016 Q3(3)
線形モデルの未知の母数βの3つの不偏推定量の各分散の大小関係を求めました。
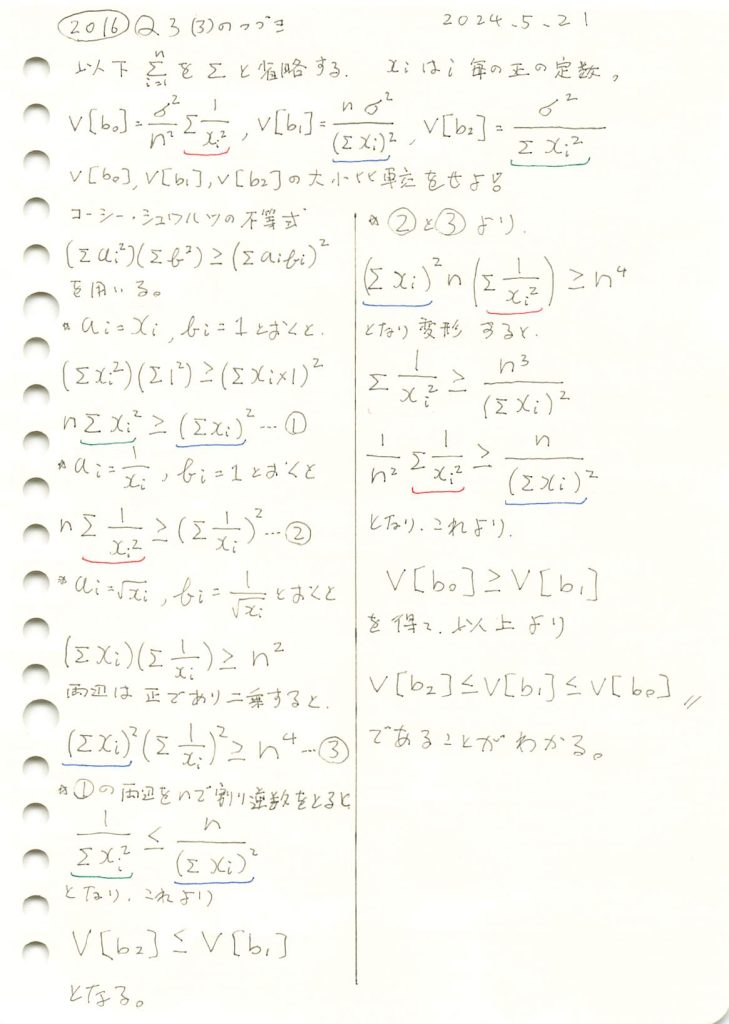
コード
線形モデルのパラメータβの推定量b0,b1,b2の分散の違いを理論式に基づいて確認します。説明変数xiには一様分布に従う値を与え、サンプル数nを変化させて、各推定量の分散の変化を視覚的に比較してみます。ここでは各推定量の違いが分かりやすいように、分散の代わりに標準偏差を視覚化しています。詳しくは前記事(https://statistics.blue/2016-q33/)を参照。
# 2016 Q3(3)  2024.11.22

import numpy as np
import matplotlib.pyplot as plt

# パラメータ設定
sigma = 1  # 誤差の標準偏差
true_beta = 2  # 真のβ
sample_sizes = np.arange(10, 101, 10)  # サンプルサイズ n を 10 から 100 まで 10 刻みで変化

# 理論的な分散を格納するリスト
variances_b0 = []
variances_b1 = []
variances_b2 = []

# 各サンプルサイズ n に対して分散を計算
for n in sample_sizes:
    xi = np.arange(1, n + 1)  # 一様に分布した x_i を生成 (例: 1, 2, ..., n)
    sum_xi = np.sum(xi)
    sum_xi_squared = np.sum(xi**2)
    sum_1_over_xi_squared = np.sum(1 / xi**2)

    # 分散を理論式で計算
    V_b0 = (sigma**2 / n**2) * sum_1_over_xi_squared
    V_b1 = (sigma**2 * n) / (sum_xi**2)
    V_b2 = sigma**2 / sum_xi_squared

    variances_b0.append(V_b0)
    variances_b1.append(V_b1)
    variances_b2.append(V_b2)

# 理論値からの標準偏差として各分散の平方根を計算
std_b0 = np.sqrt(variances_b0)
std_b1 = np.sqrt(variances_b1)
std_b2 = np.sqrt(variances_b2)

# グラフ作成
plt.figure(figsize=(10, 6))
plt.plot(sample_sizes, std_b0, label='$|b_0 - \\beta|$ (標準偏差)', marker='o', linestyle='dashed', color='red')
plt.plot(sample_sizes, std_b1, label='$|b_1 - \\beta|$ (標準偏差)', marker='x', linestyle='dashed', color='orange')
plt.plot(sample_sizes, std_b2, label='$|b_2 - \\beta|$ (標準偏差)', marker='s', linestyle='dashed', color='purple')

plt.axhline(y=0, color='green', linestyle='solid', label='真の値 $\\beta = 2$')
plt.xlabel('サンプルサイズ $n$')
plt.ylabel('真の値からの標準偏差')
plt.title('推定量 $b_0, b_1, b_2$ の真の値からのずれ(標準偏差)')
plt.legend()
plt.grid(True)
plt.show()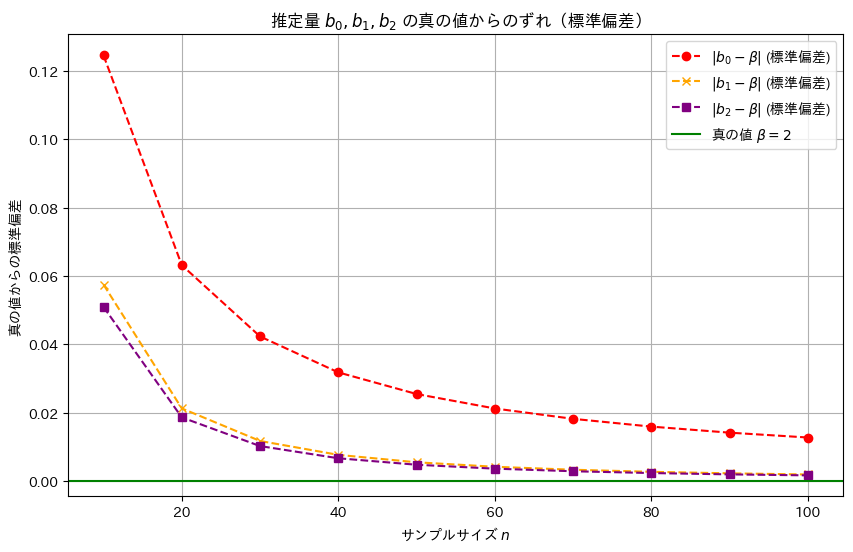
推定量b2,b1,b0の順に標準誤差は小さく、分散も同様の順序で小さくなることが確認できました。この結果から、最小二乗推定量b2が最も効率的であり、推定の安定性が高いことが再確認できました。
2016 Q3(3)
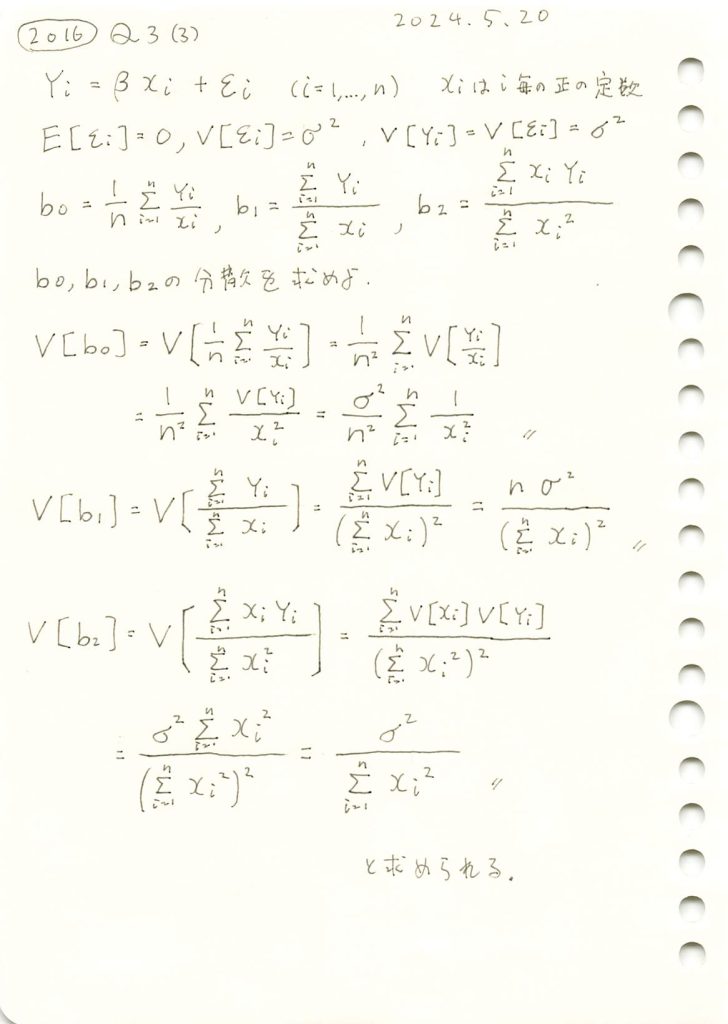
線形モデルの未知の母数βの3つの不偏推定量の各分散を求めました。
コード
線形モデルのパラメータβの推定量b0,b1,b2の分散の違いを理論式に基づいて確認します。説明変数xiには一様分布に従う値を与え、サンプル数nを変化させて、各推定量の分散の変化を視覚的に比較してみます。
# 2016 Q3(3)  2024.11.22

import numpy as np
import matplotlib.pyplot as plt

# パラメータ設定
sigma = 1  # 誤差の標準偏差
sample_sizes = np.arange(10, 101, 10)  # サンプルサイズ n を 10 から 100 まで 10 刻みで変化

# 理論的な分散を格納するリスト
variances_b0 = []
variances_b1 = []
variances_b2 = []

# 各サンプルサイズ n に対して分散を計算
for n in sample_sizes:
    xi = np.arange(1, n + 1)  # 一様に分布した x_i を生成 (例: 1, 2, ..., n)
    sum_xi = np.sum(xi)
    sum_xi_squared = np.sum(xi**2)
    sum_1_over_xi_squared = np.sum(1 / xi**2)

    # 分散を理論式で計算
    V_b0 = (sigma**2 / n**2) * sum_1_over_xi_squared
    V_b1 = (sigma**2 * n) / (sum_xi**2)
    V_b2 = sigma**2 / sum_xi_squared

    variances_b0.append(V_b0)
    variances_b1.append(V_b1)
    variances_b2.append(V_b2)

# グラフ作成
plt.figure(figsize=(10, 6))
plt.plot(sample_sizes, variances_b0, label='$V[b_0]$', marker='o', linestyle='dashed', color='red')
plt.plot(sample_sizes, variances_b1, label='$V[b_1]$', marker='x', linestyle='dashed', color='orange')
plt.plot(sample_sizes, variances_b2, label='$V[b_2]$', marker='s', linestyle='dashed', color='purple')

plt.xlabel('サンプルサイズ $n$')
plt.ylabel('分散')
plt.title('推定量 $b_0$, $b_1$, $b_2$ の理論的分散')
plt.legend()
plt.grid(True)
plt.show()
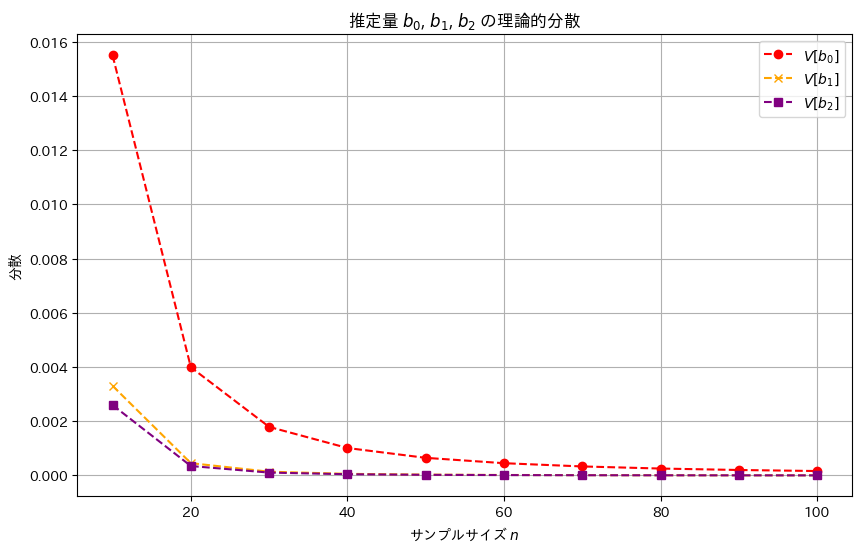
推定量b2,b1,b0の順に分散は小さく見え、b2,b1,b0の順により安定した推定量であることが確認できました。
推定量b1,b2が重なっていて見えづらいため、標準誤差でも視覚化してみます。
# 2016 Q3(3)  2024.11.22

import numpy as np
import matplotlib.pyplot as plt

# パラメータ設定
sigma = 1  # 誤差の標準偏差
true_beta = 2  # 真のβ
sample_sizes = np.arange(10, 101, 10)  # サンプルサイズ n を 10 から 100 まで 10 刻みで変化

# 理論的な分散を格納するリスト
variances_b0 = []
variances_b1 = []
variances_b2 = []

# 各サンプルサイズ n に対して分散を計算
for n in sample_sizes:
    xi = np.arange(1, n + 1)  # 一様に分布した x_i を生成 (例: 1, 2, ..., n)
    sum_xi = np.sum(xi)
    sum_xi_squared = np.sum(xi**2)
    sum_1_over_xi_squared = np.sum(1 / xi**2)

    # 分散を理論式で計算
    V_b0 = (sigma**2 / n**2) * sum_1_over_xi_squared
    V_b1 = (sigma**2 * n) / (sum_xi**2)
    V_b2 = sigma**2 / sum_xi_squared

    variances_b0.append(V_b0)
    variances_b1.append(V_b1)
    variances_b2.append(V_b2)

# 理論値からの標準偏差として各分散の平方根を計算
std_b0 = np.sqrt(variances_b0)
std_b1 = np.sqrt(variances_b1)
std_b2 = np.sqrt(variances_b2)

# グラフ作成
plt.figure(figsize=(10, 6))
plt.plot(sample_sizes, std_b0, label='$|b_0 - \\beta|$ (標準偏差)', marker='o', linestyle='dashed', color='red')
plt.plot(sample_sizes, std_b1, label='$|b_1 - \\beta|$ (標準偏差)', marker='x', linestyle='dashed', color='orange')
plt.plot(sample_sizes, std_b2, label='$|b_2 - \\beta|$ (標準偏差)', marker='s', linestyle='dashed', color='purple')

plt.axhline(y=0, color='green', linestyle='solid', label='真の値 $\\beta = 2$')
plt.xlabel('サンプルサイズ $n$')
plt.ylabel('真の値からの標準偏差')
plt.title('推定量 $b_0, b_1, b_2$ の真の値からのずれ(標準偏差)')
plt.legend()
plt.grid(True)
plt.show()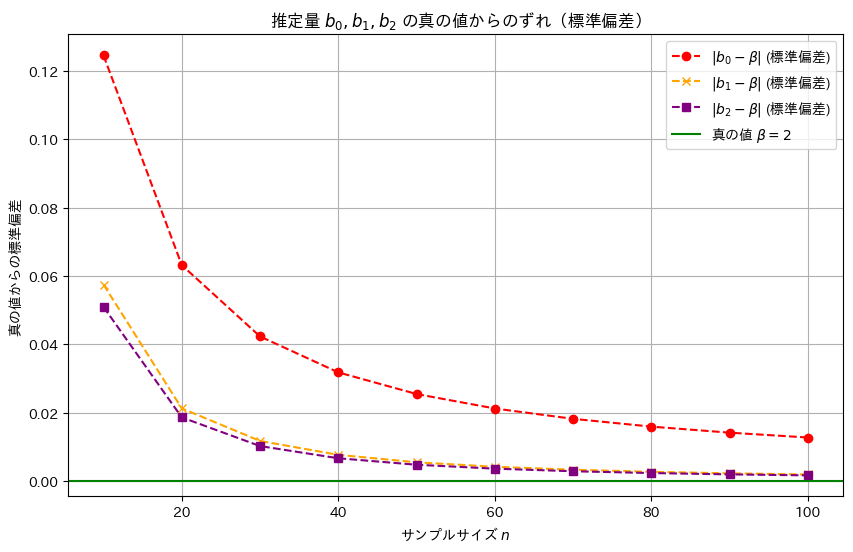
推定量b2,b1,b0の順に標準誤差は小さく、分散も同様の順序で小さくなることが確認できました。この結果から、最小二乗推定量b2が最も効率的であり、推定の安定性が高いことが再確認できました。