ホーム » モンテカルロ法
「モンテカルロ法」カテゴリーアーカイブ
2016 Q4(4)
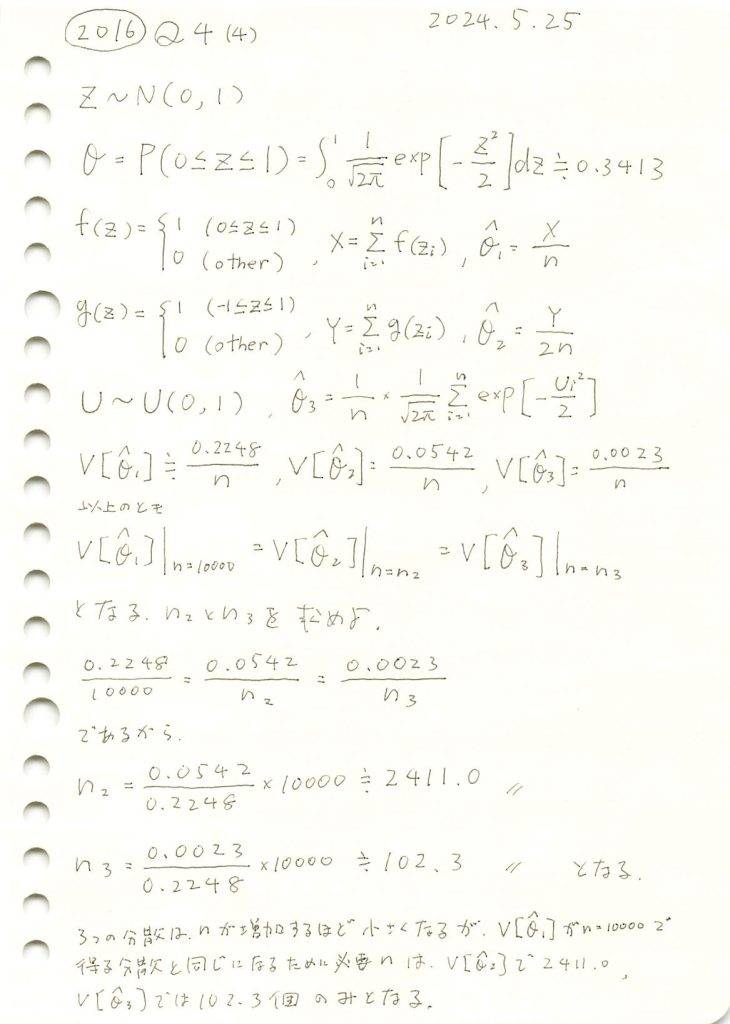
標準正規分布に従う乱数が0以上1以下となる確率の3つ推定量の分散が同じになるためのサンプル数を求めました。
コード
θの三つの推定量![]() ,
,![]() ,
,![]() の分布と分散を視覚化し比較します。まずn1=n2=n3=10000としてシミュレーションを行います。
の分布と分散を視覚化し比較します。まずn1=n2=n3=10000としてシミュレーションを行います。
# 2016 Q4(4)  2024.11.26

# n を同じ値に設定して三つの推定量を比較する

# 必要なライブラリをインポート
import numpy as np
import matplotlib.pyplot as plt

# パラメータ設定
n_common = 10000  # n を全ての推定量で共通に設定
n_trials = 1000  # シミュレーション試行回数

# 推定量のリストを作成
theta_hat_1_values = []
theta_hat_2_values = []
theta_hat_3_values = []

# シミュレーション実行
for _ in range(n_trials):
    # 推定量 θ̂1
    samples_1 = np.random.normal(0, 1, n_common)
    X = np.sum((samples_1 >= 0) & (samples_1 <= 1))
    theta_hat_1_values.append(X / n_common)

    # 推定量 θ̂2
    samples_2 = np.random.normal(0, 1, n_common)
    Y = np.sum(np.abs(samples_2) <= 1)
    theta_hat_2_values.append(Y / (2 * n_common))

    # 推定量 θ̂3
    U = np.random.uniform(0, 1, n_common)
    theta_hat_3 = np.mean((1 / np.sqrt(2 * np.pi)) * np.exp(-U**2 / 2))
    theta_hat_3_values.append(theta_hat_3)

# 各推定量の分散を計算
var_theta_hat_1 = np.var(theta_hat_1_values)
var_theta_hat_2 = np.var(theta_hat_2_values)
var_theta_hat_3 = np.var(theta_hat_3_values)

# グラフ描画
fig = plt.figure(figsize=(12, 8))  # 全体の図を作成
gs = fig.add_gridspec(3, 2, width_ratios=[3, 1])  # ヒストグラムとバーグラフの比率を指定

# 共通の横軸レンジ
x_min, x_max = 0.325, 0.355

# ヒストグラム: θ̂1
ax1 = fig.add_subplot(gs[0, 0])
ax1.hist(theta_hat_1_values, bins=20, density=True, color='blue', alpha=0.7, label='$\\hat{\\theta}_1$')
ax1.axvline(theta, color='red', linestyle='--', label='理論値 $\\theta$')
ax1.set_xlim(x_min, x_max)
ax1.set_title('$\\hat{\\theta}_1$ の分布 (n = 1,000)', fontsize=12)
ax1.set_ylabel('確率密度', fontsize=10)
ax1.legend(fontsize=10)
ax1.grid(alpha=0.3)

# ヒストグラム: θ̂2
ax2 = fig.add_subplot(gs[1, 0])
ax2.hist(theta_hat_2_values, bins=20, density=True, color='green', alpha=0.7, label='$\\hat{\\theta}_2$')
ax2.axvline(theta, color='red', linestyle='--', label='理論値 $\\theta$')
ax2.set_xlim(x_min, x_max)
ax2.set_title('$\\hat{\\theta}_2$ の分布 (n = 1,000)', fontsize=12)
ax2.set_ylabel('確率密度', fontsize=10)
ax2.legend(fontsize=10)
ax2.grid(alpha=0.3)

# ヒストグラム: θ̂3
ax3 = fig.add_subplot(gs[2, 0])
ax3.hist(theta_hat_3_values, bins=20, density=True, color='orange', alpha=0.7, label='$\\hat{\\theta}_3$')
ax3.axvline(theta, color='red', linestyle='--', label='理論値 $\\theta$')
ax3.set_xlim(x_min, x_max)
ax3.set_title('$\\hat{\\theta}_3$ の分布 (n = 1,000)', fontsize=12)
ax3.set_xlabel('推定値', fontsize=10)
ax3.set_ylabel('確率密度', fontsize=10)
ax3.legend(fontsize=10)
ax3.grid(alpha=0.3)

# バーグラフ
ax_bar = fig.add_subplot(gs[:, 1])  # 全行を使う
labels = ['$\\hat{\\theta}_1$', '$\\hat{\\theta}_2$', '$\\hat{\\theta}_3$']
variances = [var_theta_hat_1, var_theta_hat_2, var_theta_hat_3]
colors = ['blue', 'green', 'orange']

ax_bar.bar(labels, variances, color=colors, alpha=0.7)
ax_bar.set_title('各推定量の分散 (n = 1,000)', fontsize=12)
ax_bar.set_ylabel('分散', fontsize=10)
ax_bar.grid(axis='y', alpha=0.3)

# 全体の調整
plt.tight_layout()
plt.show()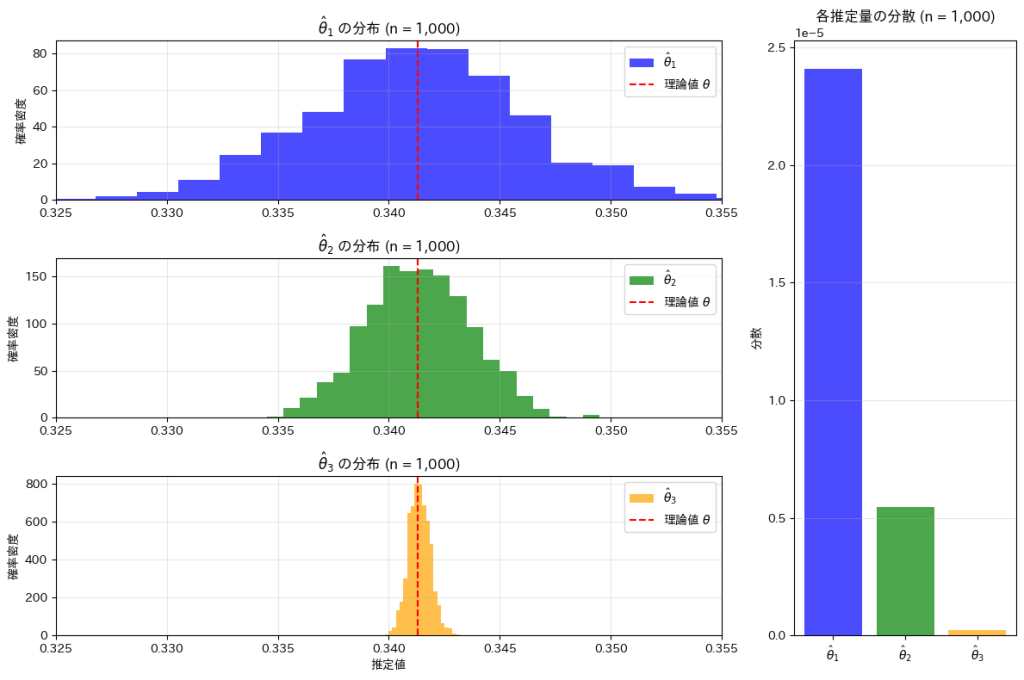
![]() <
<![]() <
<![]() の順にバラつきが小さくなり、分散も同様に小さくなっていることが確認できました。
の順にバラつきが小さくなり、分散も同様に小さくなっていることが確認できました。
次に、n1=10000, n2=2411, n3 = 102に設定してシミュレーションを行います。
# 2016 Q4(4)  2024.11.26

# 必要なライブラリをインポート
import numpy as np
import matplotlib.pyplot as plt

# パラメータ設定
n1, n2, n3 = 10000, 2411, 102  # 各推定量のサンプルサイズ
theta = 0.3413  # 理論値
n_trials = 1000  # シミュレーション試行回数

# 推定量のリストを作成
theta_hat_1_values = []
theta_hat_2_values = []
theta_hat_3_values = []

# シミュレーション実行
for _ in range(n_trials):
    # 推定量 θ̂1
    samples_1 = np.random.normal(0, 1, n1)
    X = np.sum((samples_1 >= 0) & (samples_1 <= 1))
    theta_hat_1_values.append(X / n1)

    # 推定量 θ̂2
    samples_2 = np.random.normal(0, 1, n2)
    Y = np.sum(np.abs(samples_2) <= 1)
    theta_hat_2_values.append(Y / (2 * n2))

    # 推定量 θ̂3
    U = np.random.uniform(0, 1, n3)
    theta_hat_3 = np.mean((1 / np.sqrt(2 * np.pi)) * np.exp(-U**2 / 2))
    theta_hat_3_values.append(theta_hat_3)

# 各推定量の分散を計算
var_theta_hat_1 = np.var(theta_hat_1_values)
var_theta_hat_2 = np.var(theta_hat_2_values)
var_theta_hat_3 = np.var(theta_hat_3_values)

# グラフ描画
fig = plt.figure(figsize=(12, 8))  # 全体の図を作成
gs = fig.add_gridspec(3, 2, width_ratios=[3, 1])  # ヒストグラムとバーグラフの比率を指定

# 共通の横軸レンジ
x_min, x_max = 0.325, 0.355

# ヒストグラム: θ̂1
ax1 = fig.add_subplot(gs[0, 0])
ax1.hist(theta_hat_1_values, bins=20, density=True, color='blue', alpha=0.7, label='$\\hat{\\theta}_1$')
ax1.axvline(theta, color='red', linestyle='--', label='理論値 $\\theta$')
ax1.set_xlim(x_min, x_max)
ax1.set_title('$\\hat{\\theta}_1$ の分布 (n = 10,000)', fontsize=12)
ax1.set_ylabel('確率密度', fontsize=10)
ax1.legend(fontsize=10)
ax1.grid(alpha=0.3)

# ヒストグラム: θ̂2
ax2 = fig.add_subplot(gs[1, 0])
ax2.hist(theta_hat_2_values, bins=20, density=True, color='green', alpha=0.7, label='$\\hat{\\theta}_2$')
ax2.axvline(theta, color='red', linestyle='--', label='理論値 $\\theta$')
ax2.set_xlim(x_min, x_max)
ax2.set_title('$\\hat{\\theta}_2$ の分布 (n = 2,411)', fontsize=12)
ax2.set_ylabel('確率密度', fontsize=10)
ax2.legend(fontsize=10)
ax2.grid(alpha=0.3)

# ヒストグラム: θ̂3
ax3 = fig.add_subplot(gs[2, 0])
ax3.hist(theta_hat_3_values, bins=20, density=True, color='orange', alpha=0.7, label='$\\hat{\\theta}_3$')
ax3.axvline(theta, color='red', linestyle='--', label='理論値 $\\theta$')
ax3.set_xlim(x_min, x_max)
ax3.set_title('$\\hat{\\theta}_3$ の分布 (n = 102)', fontsize=12)
ax3.set_xlabel('推定値', fontsize=10)
ax3.set_ylabel('確率密度', fontsize=10)
ax3.legend(fontsize=10)
ax3.grid(alpha=0.3)

# バーグラフ
ax_bar = fig.add_subplot(gs[:, 1])  # 全行を使う
labels = ['$\\hat{\\theta}_1$', '$\\hat{\\theta}_2$', '$\\hat{\\theta}_3$']
variances = [var_theta_hat_1, var_theta_hat_2, var_theta_hat_3]
colors = ['blue', 'green', 'orange']

ax_bar.bar(labels, variances, color=colors, alpha=0.7)
ax_bar.set_title('各推定量の分散', fontsize=12)
ax_bar.set_ylabel('分散', fontsize=10)
ax_bar.grid(axis='y', alpha=0.3)

# 全体の調整
plt.tight_layout()
plt.show()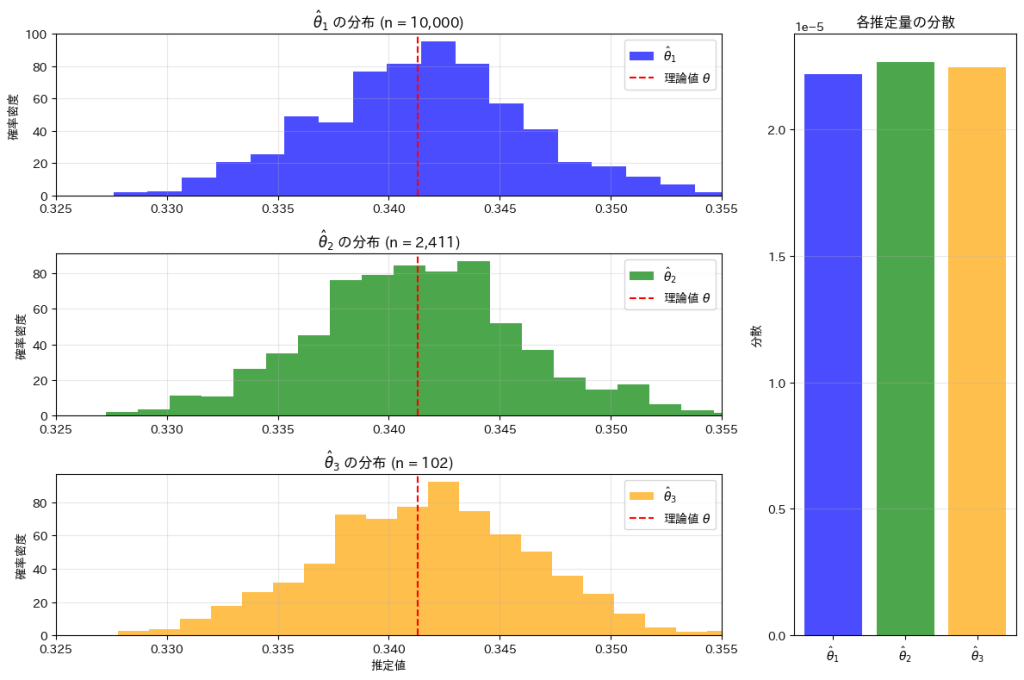
n1=10000, n2=2411, n3 = 102に設定することで、![]() ,
,![]() ,
,![]() のバラつきと分散がそれぞれほぼ等しくなっていることが確認できました。
のバラつきと分散がそれぞれほぼ等しくなっていることが確認できました。
2016 Q4(3)
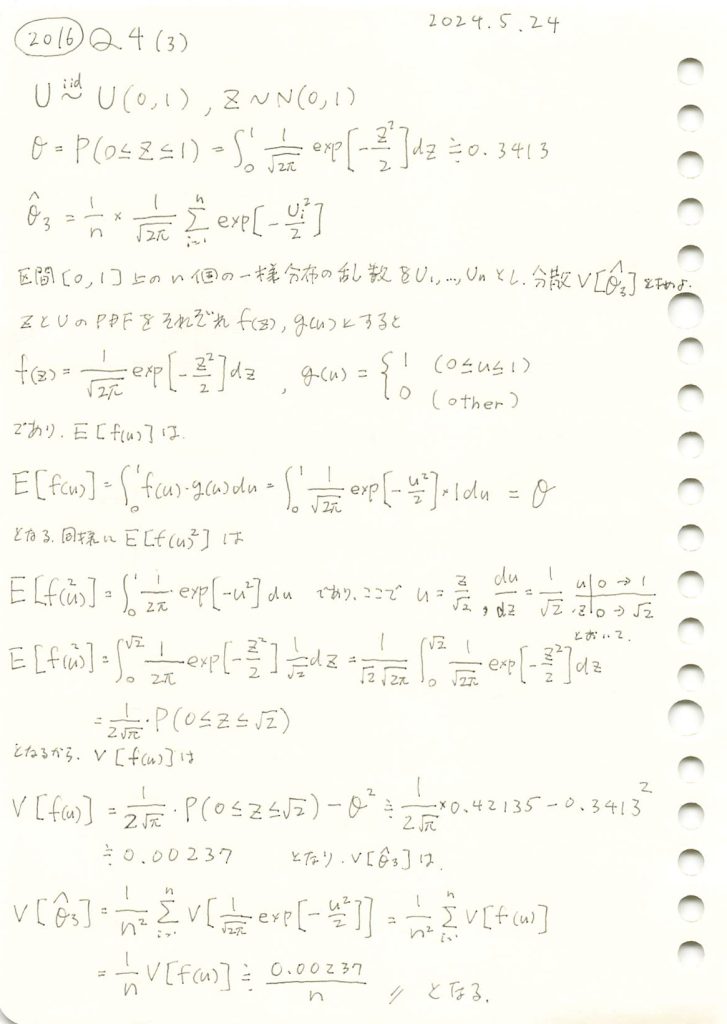
一様分布に従う確率変数を標準正規分布の確率密度関数に与え、その標本平均の分散を求めました。
コード
θの三つの推定量![]() ,
,![]() ,
,![]() についてシミュレーションを行い、それぞれの分布を確認します。(
についてシミュレーションを行い、それぞれの分布を確認します。(![]() ,
,![]() については前問参照https://statistics.blue/2016-q41/,https://statistics.blue/2016-q42/)
については前問参照https://statistics.blue/2016-q41/,https://statistics.blue/2016-q42/)
# 2016 Q4(3)  2024.11.25

import numpy as np
import matplotlib.pyplot as plt
from scipy.stats import norm

# パラメータの設定
n = 100  # サンプルサイズ
n_trials = 1000  # シミュレーション試行回数
theta = 0.3413  # 真の成功確率

# 推定量 1: θ̂1 = X / n
theta_hat_1_values = []
for _ in range(n_trials):
    samples = np.random.normal(0, 1, n)
    X = np.sum((samples >= 0) & (samples <= 1))  # 0 <= Z <= 1 のカウント
    theta_hat_1_values.append(X / n)

# 推定量 2: θ̂2 = Y / (2n)
theta_hat_2_values = []
for _ in range(n_trials):
    samples = np.random.normal(0, 1, n)
    Y = np.sum(np.abs(samples) <= 1)  # |Z| <= 1 のカウント
    theta_hat_2_values.append(Y / (2 * n))

# 推定量 3: θ̂3 = 平均
theta_hat_3_values = []
for _ in range(n_trials):
    U = np.random.uniform(0, 1, n)  # 一様分布 [0, 1]
    theta_hat_3 = np.mean((1 / np.sqrt(2 * np.pi)) * np.exp(-U**2 / 2))
    theta_hat_3_values.append(theta_hat_3)

# ヒストグラムのプロット
plt.figure(figsize=(10, 6))

# ヒストグラム: θ̂1
plt.hist(theta_hat_1_values, bins=30, density=True, alpha=0.5, label='$\\hat{\\theta}_1$', color='blue')

# ヒストグラム: θ̂2
plt.hist(theta_hat_2_values, bins=30, density=True, alpha=0.5, label='$\\hat{\\theta}_2$', color='green')

# ヒストグラム: θ̂3
plt.hist(theta_hat_3_values, bins=30, density=True, alpha=0.5, label='$\\hat{\\theta}_3$', color='orange')

# 理論分布 (正規分布) の線を重ねる
x = np.linspace(0.2, 0.5, 500)
std_theta_hat_1 = np.sqrt(theta * (1 - theta) / n)
std_theta_hat_2 = np.sqrt(2 * theta * (1 - 2 * theta) / (4 * n))
std_theta_hat_3 = np.sqrt(0.0023 / n)

plt.plot(x, norm.pdf(x, loc=theta, scale=std_theta_hat_1), 'b-', label='理論分布 ($\\hat{\\theta}_1$)')
plt.plot(x, norm.pdf(x, loc=theta, scale=std_theta_hat_2), 'g-', label='理論分布 ($\\hat{\\theta}_2$)')
plt.plot(x, norm.pdf(x, loc=theta, scale=std_theta_hat_3), 'r-', label='理論分布 ($\\hat{\\theta}_3$)')

# プロットの設定
plt.title('三つの推定量の分布と理論分布', fontsize=14)
plt.xlabel('推定値', fontsize=12)
plt.ylabel('確率密度', fontsize=12)
plt.legend(fontsize=12)
plt.grid(alpha=0.3)

# グラフの表示
plt.show()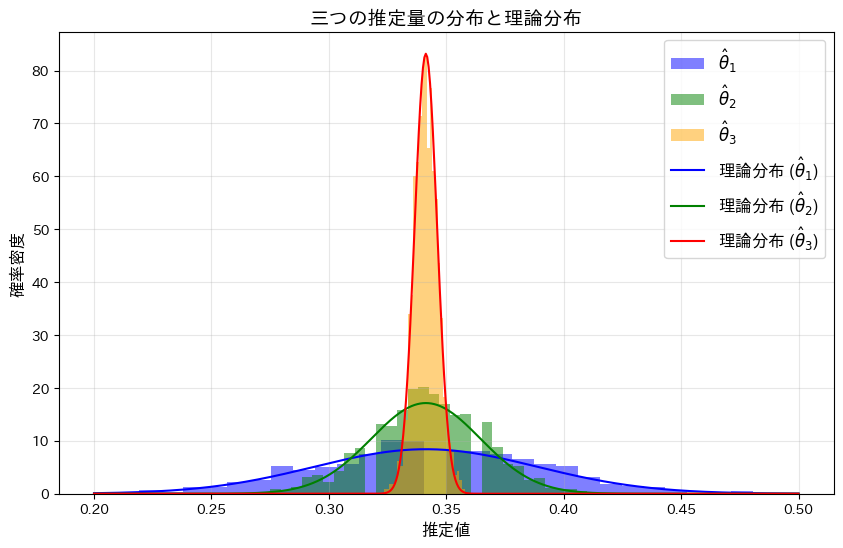
![]() <
<![]() <
<![]() の順にバラつきが小さくなり、分散が最も小さい
の順にバラつきが小さくなり、分散が最も小さい![]() がこの中で最も優れた推定量であることが分かりました。
がこの中で最も優れた推定量であることが分かりました。
2016 Q4(2)
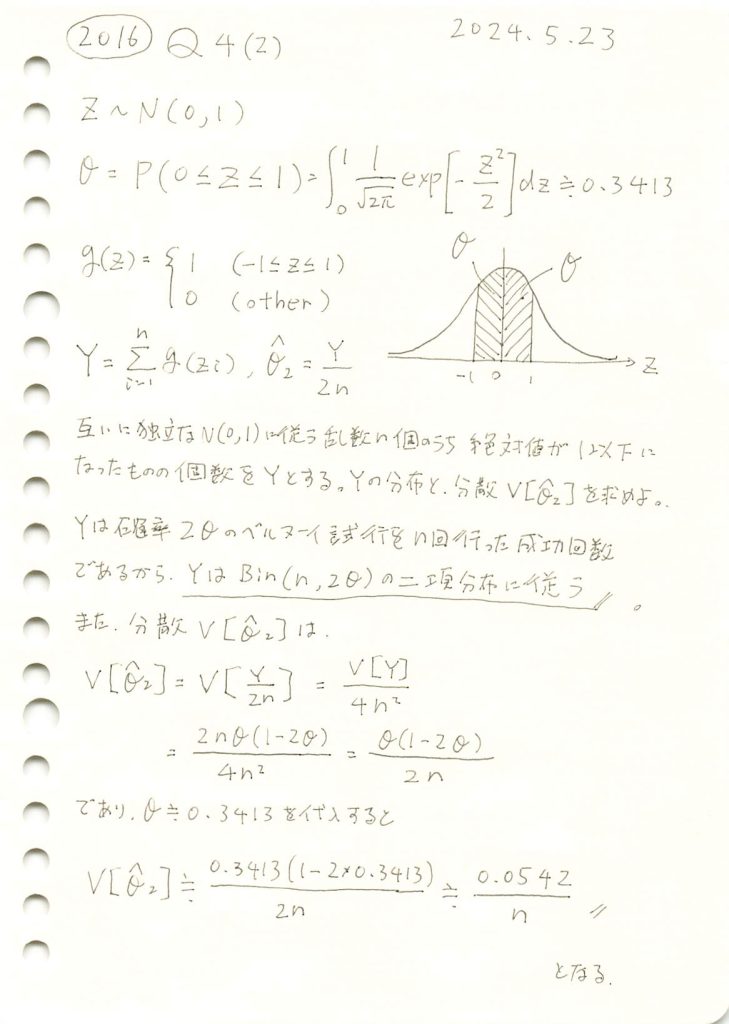
n個の標準正規分布に従う乱数が-1以上1以下となる個数が従う分布を求めました。また乱数が0以上1以下となる確率の推定値の分散を求めました。
コード
この実験では、標準正規分布N(0,1)と、n個の標準正規分布に従う乱数のうち-1以上1以下となる個数Yの分布、およびその確率を推定する量![]() の分布を確認します。
の分布を確認します。
# 2016 Q4(2)  2024.11.24

import numpy as np
import matplotlib.pyplot as plt
from scipy.stats import binom, norm

# ---- グラフ 1: 標準正規分布 N(0,1) と範囲 (|Z| < 1) ----
# パラメータの設定
n_samples = 10000  # サンプル数
z_min, z_max = -1, 1  # 条件の範囲 (|Z| < 1)

# 標準正規分布 N(0,1) に従う乱数を生成します
samples = np.random.normal(0, 1, n_samples)

# 理論的な標準正規分布の確率密度関数を計算します
x1 = np.linspace(-4, 4, 500)
pdf_theoretical = norm.pdf(x1, loc=0, scale=1)

# ---- グラフ 2: Y の分布(二項分布) ----
# シミュレーションの設定
n_trials = 1000  # シミュレーションの試行回数
n = 50  # サンプルサイズ (1試行あたりの乱数生成数)
theta = 0.3413  # 真の成功確率 (0 < Z < 1)

# Y の分布を計算
Y_values = []
for _ in range(n_trials):
    samples_trial = np.random.normal(0, 1, n)
    Y = np.sum((samples_trial > z_min) & (samples_trial < z_max))  # 絶対値が1以下の個数
    Y_values.append(Y)

# 理論的な二項分布
p_Y = 2 * theta  # |Z| < 1 の確率
x2 = np.arange(0, n + 1)
binomial_pmf_Y = binom.pmf(x2, n, p_Y)

# ---- グラフ 3: θ̂2 の分布と理論分布 ----
# θ̂2 = Y / (2n) を計算
theta_hat_2_values = [Y / (2 * n) for Y in Y_values]

# 理論分布用のデータ
x3 = np.linspace(0, 1, 100)
binomial_pdf_theta_2 = norm.pdf(x3, loc=p_Y / 2, scale=np.sqrt(p_Y * (1 - p_Y) / (4 * n)))

# ---- 3つのグラフを描画 ----
plt.figure(figsize=(10, 12))  # グラフ全体のサイズを指定

# グラフ 1
plt.subplot(3, 1, 1)
plt.hist(samples, bins=50, density=True, alpha=0.5, label='全データ (N(0,1))', color='purple')
plt.axvspan(z_min, z_max, color='orange', alpha=0.3, label='|Z| < 1 の領域')
plt.plot(x1, pdf_theoretical, 'r-', label='理論分布 (N(0,1))', linewidth=2)
plt.title('N(0,1) に従う乱数のヒストグラムと領域', fontsize=14)
plt.xlabel('Z 値', fontsize=12)
plt.ylabel('確率密度', fontsize=12)
plt.legend(fontsize=12)
plt.grid(alpha=0.3)

# グラフ 2
plt.subplot(3, 1, 2)
plt.hist(Y_values, bins=np.arange(0, n + 2) - 0.5, density=True, alpha=0.6, color='green', label='Y の分布 (シミュレーション)')
plt.plot(x2, binomial_pmf_Y, 'ro-', label='理論分布 (Binomial)', markersize=4)
plt.title('Y の分布と理論分布の比較', fontsize=14)
plt.xlabel('Y 値', fontsize=12)
plt.ylabel('確率密度', fontsize=12)
plt.legend(fontsize=12)
plt.grid(alpha=0.3)

# グラフ 3
plt.subplot(3, 1, 3)
plt.hist(theta_hat_2_values, bins=10, density=True, alpha=0.6, color='blue', label='$\\hat{\\theta}_2$ の分布 (シミュレーション)')
plt.plot(x3, binomial_pdf_theta_2, 'r-', label='理論分布 $N(\\theta, V[\\hat{\\theta}_2])$', linewidth=2)
plt.title('$\\hat{\\theta}_2$ の分布と理論分布の比較', fontsize=14)
plt.xlabel('$\\hat{\\theta}_2$ 値', fontsize=12)
plt.ylabel('確率密度', fontsize=12)
plt.legend(fontsize=12)
plt.grid(alpha=0.3)

# グラフを表示
plt.tight_layout()  # 全体を整える
plt.show()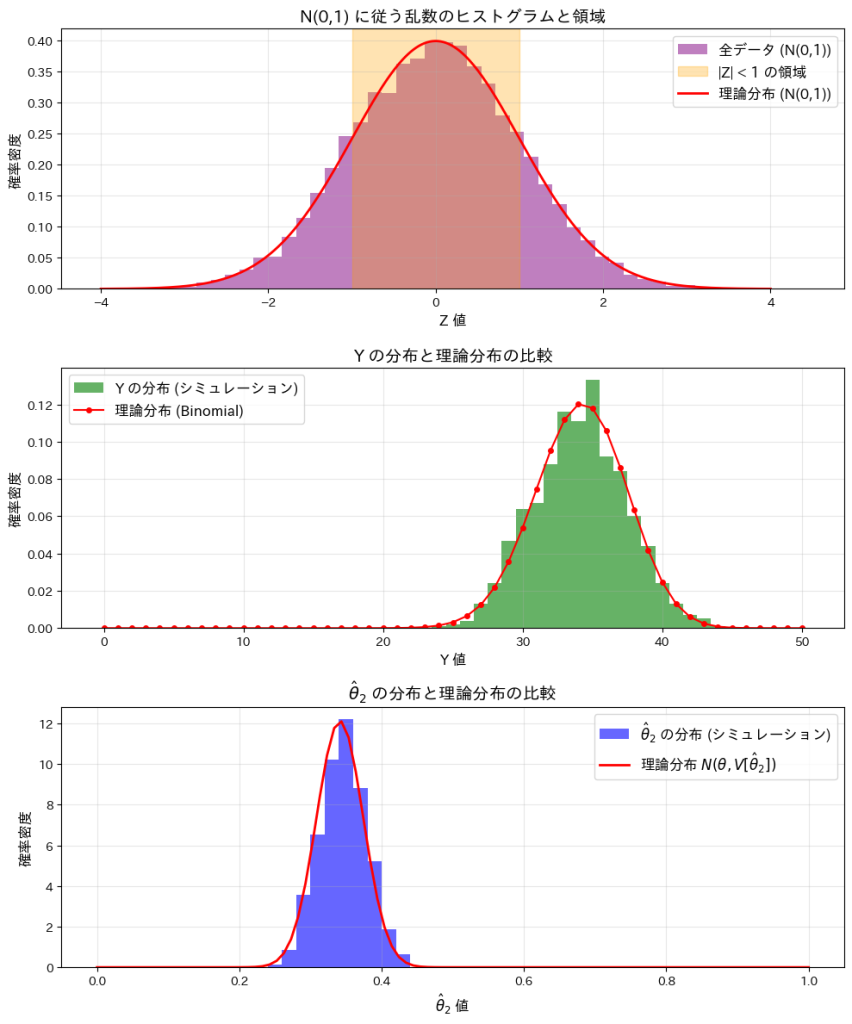
この実験によってYが二項分布B(n,2θ)に従うことと、![]() が正規分布
が正規分布![]() に従うことが確認できました。
に従うことが確認できました。
2016 Q4(1)
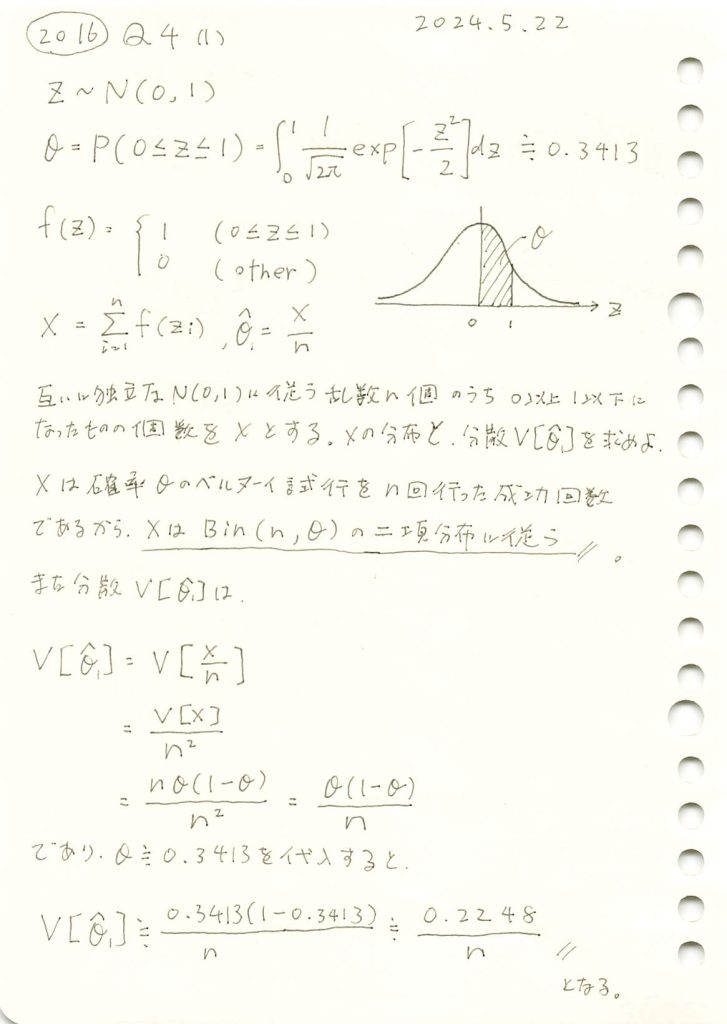
n個の標準正規分布に従う乱数が0以上1以下となる個数が従う分布を求めました。また乱数が0以上1以下となる確率の推定値の分散を求めました。
コード
この実験では、標準正規分布N(0,1)と、n個の標準正規分布に従う乱数のうち0以上1以下となる個数Xの分布、およびその確率を推定する量![]() の分布を確認します。
の分布を確認します。
# 2016 Q4(1)  2024.11.23

import numpy as np
import matplotlib.pyplot as plt
from scipy.stats import binom, norm

# ---- グラフ 1: 標準正規分布 N(0,1) と範囲 (0 < Z < 1) ----
# パラメータの設定
n_samples = 10000  # サンプル数
z_min, z_max = 0, 1  # 条件の範囲 (0 < Z < 1)

# 標準正規分布 N(0,1) に従う乱数を生成します
samples = np.random.normal(0, 1, n_samples)

# 理論的な標準正規分布の確率密度関数を計算します
x1 = np.linspace(-4, 4, 500)
pdf_theoretical = norm.pdf(x1, loc=0, scale=1)

# ---- グラフ 2: X の分布(二項分布) ----
# シミュレーションの設定
n_trials = 1000  # シミュレーションの試行回数
n = 50  # サンプルサイズ (1試行あたりの乱数生成数)
theta = 0.3413  # 真の成功確率 (0 < Z < 1)

# X の分布を計算
X_values = []
for _ in range(n_trials):
    samples_trial = np.random.normal(0, 1, n)
    X = np.sum((samples_trial > z_min) & (samples_trial < z_max))
    X_values.append(X)

# 理論的な二項分布
x2 = np.arange(0, n + 1)
binomial_pmf = binom.pmf(x2, n, theta)

# ---- グラフ 3: θ̂1 の分布と理論分布 ----
# θ̂1 = X / n を計算
theta_hat_1_values = [X / n for X in X_values]

# 理論分布用のデータ
x3 = np.linspace(0, 1, 100)
binomial_pdf = norm.pdf(x3, loc=theta, scale=np.sqrt(theta * (1 - theta) / n))

# ---- 3つのグラフを描画 ----
plt.figure(figsize=(10, 10))  # グラフ全体のサイズを指定

# グラフ 1
plt.subplot(3, 1, 1)
plt.hist(samples, bins=50, density=True, alpha=0.5, label='全データ (N(0,1))', color='purple')
plt.axvspan(z_min, z_max, color='orange', alpha=0.3, label='0 < Z < 1 の領域')
plt.plot(x1, pdf_theoretical, 'r-', label='理論分布 (N(0,1))', linewidth=2)
plt.title('N(0,1) に従う乱数のヒストグラムと領域', fontsize=14)
plt.xlabel('Z 値', fontsize=12)
plt.ylabel('確率密度', fontsize=12)
plt.legend(fontsize=12)
plt.grid(alpha=0.3)

# グラフ 2
plt.subplot(3, 1, 2)
plt.hist(X_values, bins=np.arange(0, n + 2) - 0.5, density=True, alpha=0.6, color='green', label='X の分布 (シミュレーション)')
plt.plot(x2, binomial_pmf, 'ro-', label='理論分布 (Binomial)', markersize=4)
plt.title('X の分布と理論分布の比較', fontsize=14)
plt.xlabel('X 値', fontsize=12)
plt.ylabel('確率密度', fontsize=12)
plt.legend(fontsize=12)
plt.grid(alpha=0.3)

# グラフ 3
plt.subplot(3, 1, 3)
plt.hist(theta_hat_1_values, bins=10, density=True, alpha=0.6, color='blue', label='$\\hat{\\theta}_1$ の分布 (シミュレーション)')
plt.plot(x3, binomial_pdf, 'r-', label='理論分布 $N(\\theta, V[\\hat{\\theta}_1])$', linewidth=2)
plt.title('$\\hat{\\theta}_1$ の分布と理論分布の比較', fontsize=14)
plt.xlabel('$\\hat{\\theta}_1$ 値', fontsize=12)
plt.ylabel('確率密度', fontsize=12)
plt.legend(fontsize=12)
plt.grid(alpha=0.3)

# グラフを表示
plt.tight_layout()  # 全体を整える
plt.show()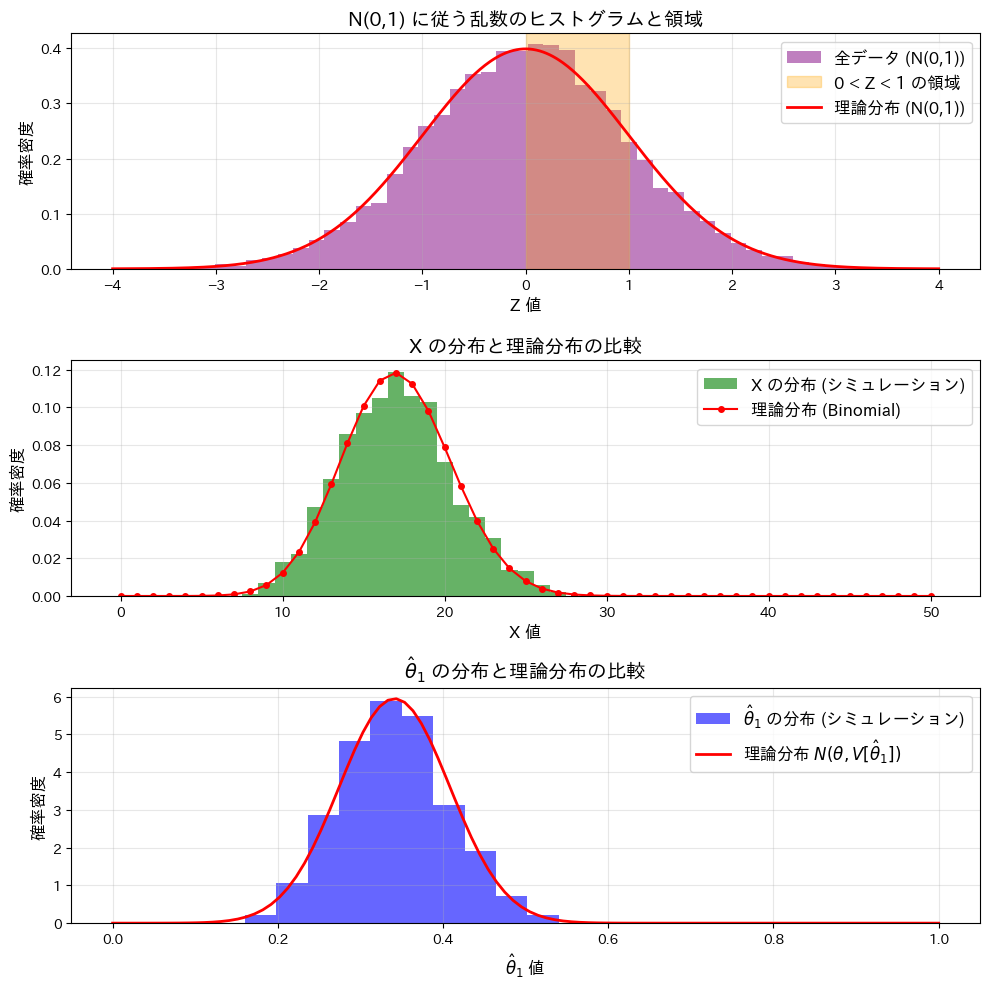
この実験によってXが二項分布B(n,θ)に従うことと、![]() が正規分布
が正規分布![]() に従うことが確認できました。
に従うことが確認できました。