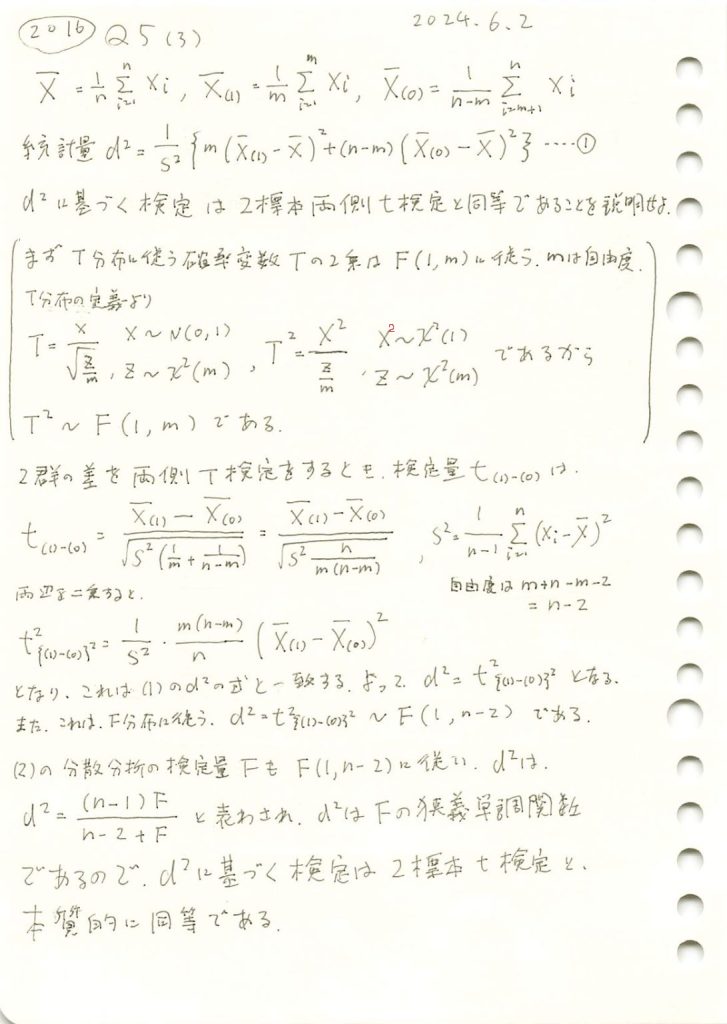
2016 Q5(3)
2群の一元配置分散分析のF検定が、2群の差の両側T検定と、本質的に同等であることを示しました。

コード
t検定(自由度n-2)と F 検定(自由度1,n-2)の p 値が等しいかシミュレーションによって検証してみます。
# 2016 Q5(3)  2024.11.29

import numpy as np
import matplotlib.pyplot as plt
from scipy.stats import t, f

# シミュレーションパラメータ
n = 100  # サンプルサイズ
repeats = 10000  # シミュレーションの繰り返し回数
alpha = 0.05  # 有意水準

# 自由度
df1 = 1  # F検定の分子自由度
df2 = n - 2  # F検定の分母自由度(t分布の自由度と一致)

# 検定結果の一致数を記録
agreement_count = 0

# p値を格納するリスト
p_values_t = []
p_values_f = []

# シミュレーションを実行
for _ in range(repeats):
    # 2群のデータを生成
    group1 = np.random.normal(loc=0, scale=1, size=n // 2)
    group2 = np.random.normal(loc=0, scale=1, size=n // 2)

    # 群間平均差の標準誤差
    pooled_var = ((np.var(group1, ddof=1) + np.var(group2, ddof=1)) / 2)
    se = np.sqrt(pooled_var * 2 / (n // 2))

    # t統計量
    t_stat = (np.mean(group1) - np.mean(group2)) / se
    t_squared = t_stat**2

    # F統計量
    f_stat = t_squared  # t^2 = F の関係を利用

    # 両検定のp値を計算
    p_value_t = 2 * (1 - t.cdf(np.abs(t_stat), df=df2))  # 両側検定
    p_value_f = 1 - f.cdf(f_stat, dfn=df1, dfd=df2)  # F検定の片側p値

    # p値を保存
    p_values_t.append(p_value_t)
    p_values_f.append(p_value_f)

    # 両検定が同じ結論を出したか確認
    reject_t = p_value_t < alpha  # t検定の結果
    reject_f = p_value_f < alpha  # F検定の結果

    if reject_t == reject_f:
        agreement_count += 1

# 一致率を計算
agreement_rate = agreement_count / repeats

# 結果を出力
print(f"t^2 検定と F 検定が一致した割合: {agreement_rate:.2%}")

# 散布図を作成
plt.figure(figsize=(8, 6))
plt.scatter(p_values_t, p_values_f, alpha=0.5, s=10, label="p値の散布図")
plt.plot([0, 1], [0, 1], 'r--', label="$y=x$")  # y=xの基準線
plt.title(r"t検定(自由度 $n-2$)と F 検定(自由度 1, $n-2$)の p 値の比較", fontsize=14)
plt.xlabel("t検定のp値", fontsize=12)
plt.ylabel("F検定のp値", fontsize=12)
plt.legend(fontsize=12)  # 凡例を追加
plt.grid(alpha=0.3)  # グリッドを薄く表示
plt.show()
t^2 検定と F 検定が一致した割合: 100.00%
t検定(自由度n-2)と F 検定(自由度1,n-2)の p 値が等しいことがシミュレーションによって確認されました。両検定が同等であることが示されました。
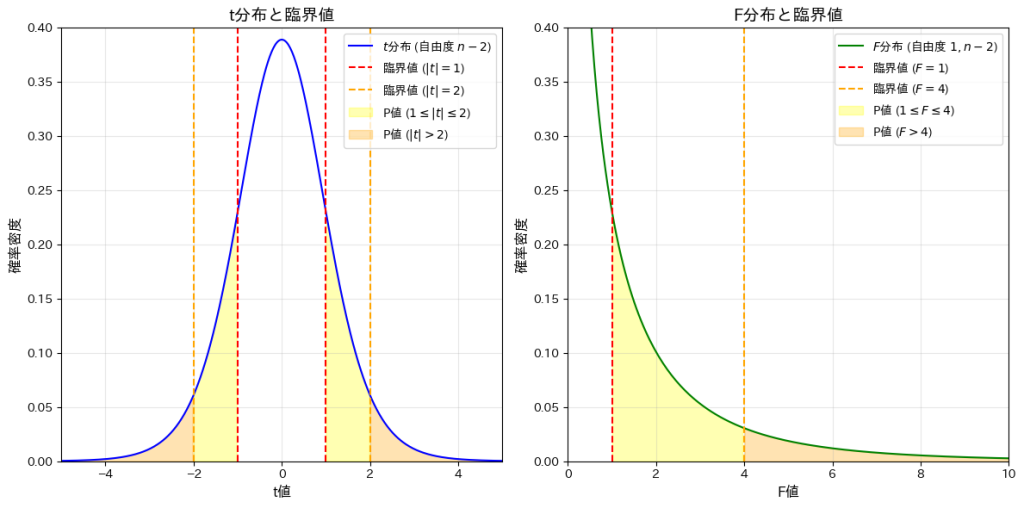
次に、t分布(自由度n-2)と F分布(自由度1,n-2)を描画します。また、t分布の臨界点|t|=1,2と、対応するF分布の臨界点F=1,4(![]() に基づく)を示し、それらで区切られた領域の確率を計算し、それらを視覚的に確認してみます。
に基づく)を示し、それらで区切られた領域の確率を計算し、それらを視覚的に確認してみます。
# 2016 Q5(3)  2024.11.29

import numpy as np
import matplotlib.pyplot as plt
from scipy.stats import t, f

# パラメータ設定
n = 12  # サンプルサイズ(自由度は n-2)
df1 = 1  # F分布の分子自由度
df2 = n - 2  # t分布とF分布の分母自由度
x_t = np.linspace(-5, 5, 500)  # t分布用のx軸範囲
x_f = np.linspace(0, 25, 500)  # F分布用のx軸範囲

# t分布とF分布の確率密度関数を計算
t_pdf = t.pdf(x_t, df=df2)  # t分布のPDF
f_pdf = f.pdf(x_f, dfn=df1, dfd=df2)  # F分布のPDF

# t分布の新しい臨界点
critical_t_1 = 1  # ±1
critical_t_2 = 2  # ±2

# F分布の新しい臨界点
critical_f_1 = 1  # F=1
critical_f_2 = 4  # F=4

# P値の計算
# t分布のP値
p_t_between = 2 * (t.cdf(critical_t_2, df=df2) - t.cdf(critical_t_1, df=df2))  # 1 <= |t| <= 2
p_t_outside = 2 * (1 - t.cdf(critical_t_2, df=df2))  # |t| > 2

# F分布のP値
p_f_between = f.cdf(critical_f_2, dfn=df1, dfd=df2) - f.cdf(critical_f_1, dfn=df1, dfd=df2)  # 1 <= F <= 4
p_f_outside = 1 - f.cdf(critical_f_2, dfn=df1, dfd=df2)  # F > 4

# P値の結果を表示
print("t分布のP値:")
print(f"  1 <= |t| <= 2 の P値: {p_t_between:.5f}")
print(f"  |t| > 2 の P値: {p_t_outside:.5f}")

print("\nF分布のP値:")
print(f"  1 <= F <= 4 の P値: {p_f_between:.5f}")
print(f"  F > 4 の P値: {p_f_outside:.5f}")

# 可視化
plt.figure(figsize=(12, 6))

# t分布のプロット
plt.subplot(1, 2, 1)
plt.plot(x_t, t_pdf, label=r"$t$分布 (自由度 $n-2$)", color="blue")
plt.axvline(-critical_t_1, color="red", linestyle="--", label=r"臨界値 ($|t| = 1$)")
plt.axvline(critical_t_1, color="red", linestyle="--")
plt.axvline(-critical_t_2, color="orange", linestyle="--", label=r"臨界値 ($|t| = 2$)")
plt.axvline(critical_t_2, color="orange", linestyle="--")
plt.fill_between(x_t, t_pdf, where=(np.abs(x_t) <= critical_t_2) & (np.abs(x_t) >= critical_t_1), color="yellow", alpha=0.3, label=r"P値 ($1 \leq |t| \leq 2$)")
plt.fill_between(x_t, t_pdf, where=(np.abs(x_t) >= critical_t_2), color="orange", alpha=0.3, label=r"P値 ($|t| > 2$)")
plt.title("t分布と臨界値", fontsize=14)
plt.xlabel("t値", fontsize=12)
plt.ylabel("確率密度", fontsize=12)
plt.legend(fontsize=10)
plt.grid(alpha=0.3)
plt.xlim(-5, 5)
plt.ylim(0, 0.4)

# F分布のプロット
plt.subplot(1, 2, 2)
plt.plot(x_f, f_pdf, label=r"$F$分布 (自由度 $1, n-2$)", color="green")
plt.axvline(critical_f_1, color="red", linestyle="--", label=r"臨界値 ($F = 1$)")
plt.axvline(critical_f_2, color="orange", linestyle="--", label=r"臨界値 ($F = 4$)")
plt.fill_between(x_f, f_pdf, where=(x_f <= critical_f_2) & (x_f >= critical_f_1), color="yellow", alpha=0.3, label=r"P値 ($1 \leq F \leq 4$)")
plt.fill_between(x_f, f_pdf, where=(x_f >= critical_f_2), color="orange", alpha=0.3, label=r"P値 ($F > 4$)")
plt.title("F分布と臨界値", fontsize=14)
plt.xlabel("F値", fontsize=12)
plt.ylabel("確率密度", fontsize=12)
plt.legend(fontsize=10)
plt.grid(alpha=0.3)
plt.xlim(0, 10)
plt.ylim(0, 0.4)

plt.tight_layout()
plt.show()
t分布のP値:
1 <= |t| <= 2 の P値: 0.26751
|t| > 2 の P値: 0.07339
F分布のP値:
1 <= F <= 4 の P値: 0.26751
F > 4 の P値: 0.07339
t分布の臨界で区切られた領域の確率と、それに対応するF分布の領域の確率が一致することを確認しました。