ホーム » コードあり (ページ 7)
「コードあり」カテゴリーアーカイブ
2016 Q2(4)
指数分布の上側確率の推定量が、ガンマ分布に従う確率変数の式で表され、それが不偏推定量であることを示しました。
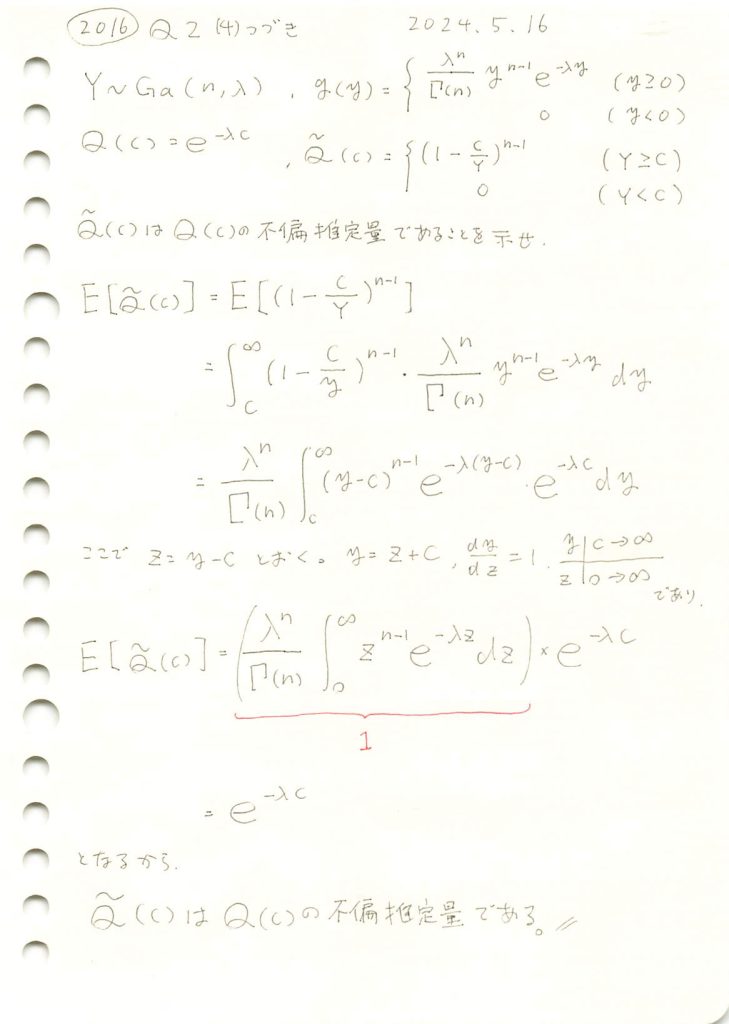
コード
![]() はnによらず
はnによらず![]() に近づきます。nを1~20に変化させてシミュレーションして確認してみます。
に近づきます。nを1~20に変化させてシミュレーションして確認してみます。
# 2016 Q2(4)  2024.11.19

import numpy as np
import matplotlib.pyplot as plt

# パラメータ設定
lambda_value = 2  # 固定されたλ
c = 1.0  # 定数c
n_values = range(1, 21)  # nを1から20まで変化させる
sample_size = 1000  # シミュレーションのサンプルサイズ

simulated_expectations = []  # シミュレーション期待値を格納するリスト
theoretical_expectations = []  # 理論値を格納するリスト

# 修正版コード
for n in n_values:
    # ガンマ分布のサンプルを生成 (Y ~ Gamma(n, λ))
    Y_samples = np.random.gamma(shape=n, scale=1/lambda_value, size=sample_size)

    # 条件付きで (1 - c/Y)^(n-1) を計算
    values = np.where(Y_samples >= c, (1 - c / Y_samples)**(n - 1), 0)

    # シミュレーション期待値を計算
    simulated_expectations.append(np.mean(values))

    # 理論値 e^(-λc) を計算
    theoretical_expectations.append(np.exp(-lambda_value * c))

# グラフの描画
plt.figure(figsize=(10, 6))
plt.plot(n_values, theoretical_expectations, 'r-o', label='理論値: e^(-λc)', linewidth=2)
plt.plot(n_values, simulated_expectations, 'b-s', label='シミュレーション期待値', linewidth=2)

# グラフの設定
plt.title('理論値とシミュレーション期待値の比較 (n を変化)', fontsize=16)
plt.xlabel('n (形状パラメータ)', fontsize=14)
plt.ylabel('期待値', fontsize=14)
plt.legend(fontsize=12)
plt.grid(True)

# プロットの表示
plt.show()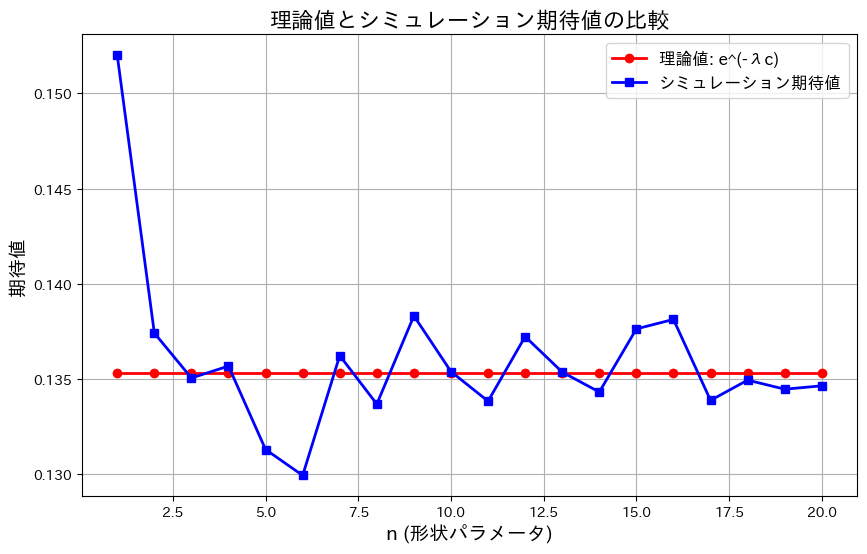
![]() はnによらず
はnによらず![]() に近づきました。グラフの縦軸の範囲が0.13~0.15と非常に狭いため、誤差が拡大して表示されているように見えます。実際の差異はごくわずかです。
に近づきました。グラフの縦軸の範囲が0.13~0.15と非常に狭いため、誤差が拡大して表示されているように見えます。実際の差異はごくわずかです。
2016 Q2(4)
指数分布の和がガンマ分布になることを示しました。
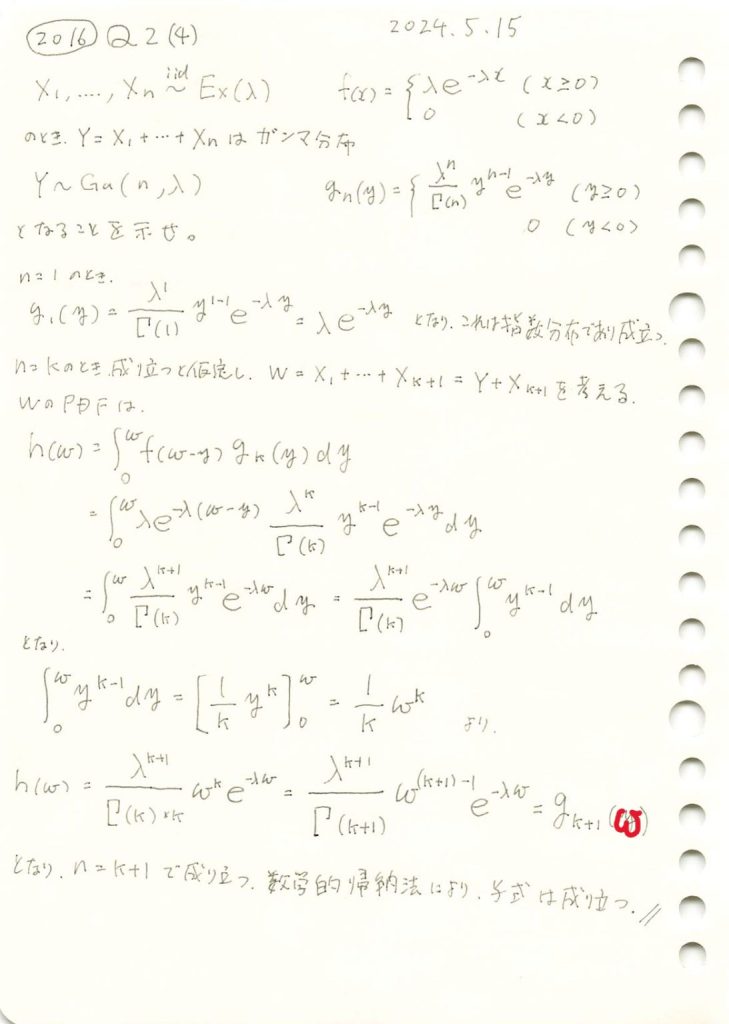
コード
指数分布に従う確率変数X1~Xnの和がガンマ分布に従うのをかを確かめるため、シミュレーションを行いました。この実験では、まずn=5の場合について確かめました。
# 2016 Q2(4)  2024.11.18

import numpy as np
import matplotlib.pyplot as plt
from scipy.stats import gamma

# パラメータ設定
lambda_value = 2  # 真のλ
n = 5  # 指数分布の和の数 (ガンマ分布の形状パラメータ)
sample_size = 10000  # シミュレーションのサンプルサイズ

# 1. 指数分布の和をシミュレーション
sum_of_exponentials = np.sum(np.random.exponential(scale=1/lambda_value, size=(sample_size, n)), axis=1)

# 2. ガンマ分布の理論値を計算
x = np.linspace(0, max(sum_of_exponentials), 1000)
gamma_pdf = gamma.pdf(x, a=n, scale=1/lambda_value)

# 3. ヒストグラムと理論的なガンマ分布をプロット
plt.figure(figsize=(10, 6))
plt.hist(sum_of_exponentials, bins=50, density=True, alpha=0.6, color='skyblue', label='シミュレーション (指数分布の和)')
plt.plot(x, gamma_pdf, 'r-', label='理論的なガンマ分布', linewidth=2)

# グラフの設定
plt.title('指数分布の和 (n=5) とガンマ分布の比較', fontsize=16)
plt.xlabel('値', fontsize=14)
plt.ylabel('密度', fontsize=14)
plt.legend(fontsize=12)
plt.grid(True)

# プロット表示
plt.show()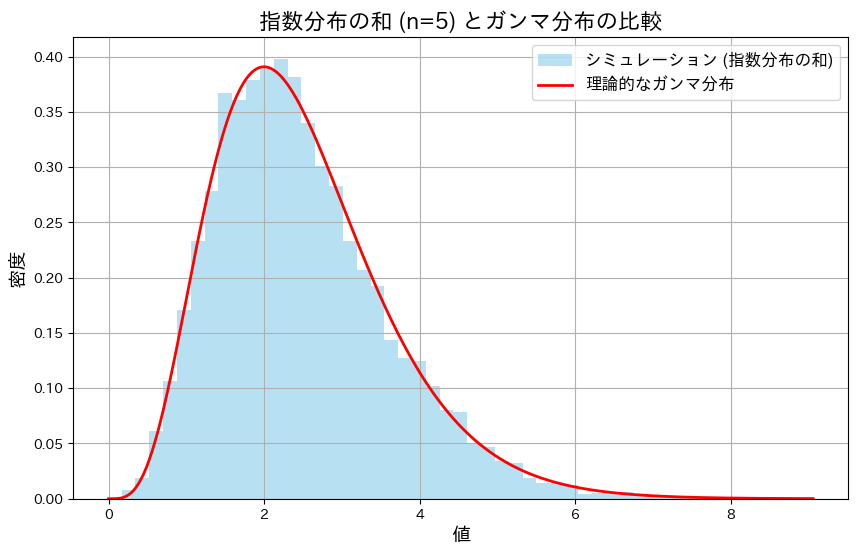
5つの指数分布の和は、形状パラメータが5のガンマ分布に一致することが確認できました。
次に、nを変化させてシミュレーションを行い、分布の形状の変化を観察します。また、それらの分布がガンマ分布と一致するかを確認します。
# 2016 Q2(4)  2024.11.18

import numpy as np
import matplotlib.pyplot as plt
from scipy.stats import gamma

# パラメータ設定
lambda_value = 2  # 真のλ
n_values = [2, 5, 10, 20]  # nの値を変化させる
sample_size = 10000  # シミュレーションのサンプルサイズ

# 2x2のグリッドでプロット
fig, axes = plt.subplots(2, 2, figsize=(12, 10))
axes = axes.flatten()

for i, n in enumerate(n_values):
    # 指数分布の和をシミュレーション
    sum_of_exponentials = np.sum(np.random.exponential(scale=1/lambda_value, size=(sample_size, n)), axis=1)

    # ガンマ分布の理論値を計算
    x = np.linspace(0, 20, 1000)  # 横軸の範囲を0~20に設定
    gamma_pdf = gamma.pdf(x, a=n, scale=1/lambda_value)

    # ヒストグラムと理論的なガンマ分布をプロット
    ax = axes[i]
    ax.hist(sum_of_exponentials, bins=50, range=(0, 20), density=True, alpha=0.6, color='skyblue', label='シミュレーション (指数分布の和)')
    ax.plot(x, gamma_pdf, 'r-', label='理論的なガンマ分布', linewidth=2)

    # グラフの設定
    ax.set_title(f'n={n}', fontsize=14)
    ax.set_xlabel('値', fontsize=12)
    ax.set_ylabel('密度', fontsize=12)
    ax.legend(fontsize=10)
    ax.grid(True)

# 全体のレイアウト調整
plt.suptitle('nを変化させた指数分布の和とガンマ分布の比較', fontsize=16)
plt.tight_layout(rect=[0, 0, 1, 0.96])
plt.show()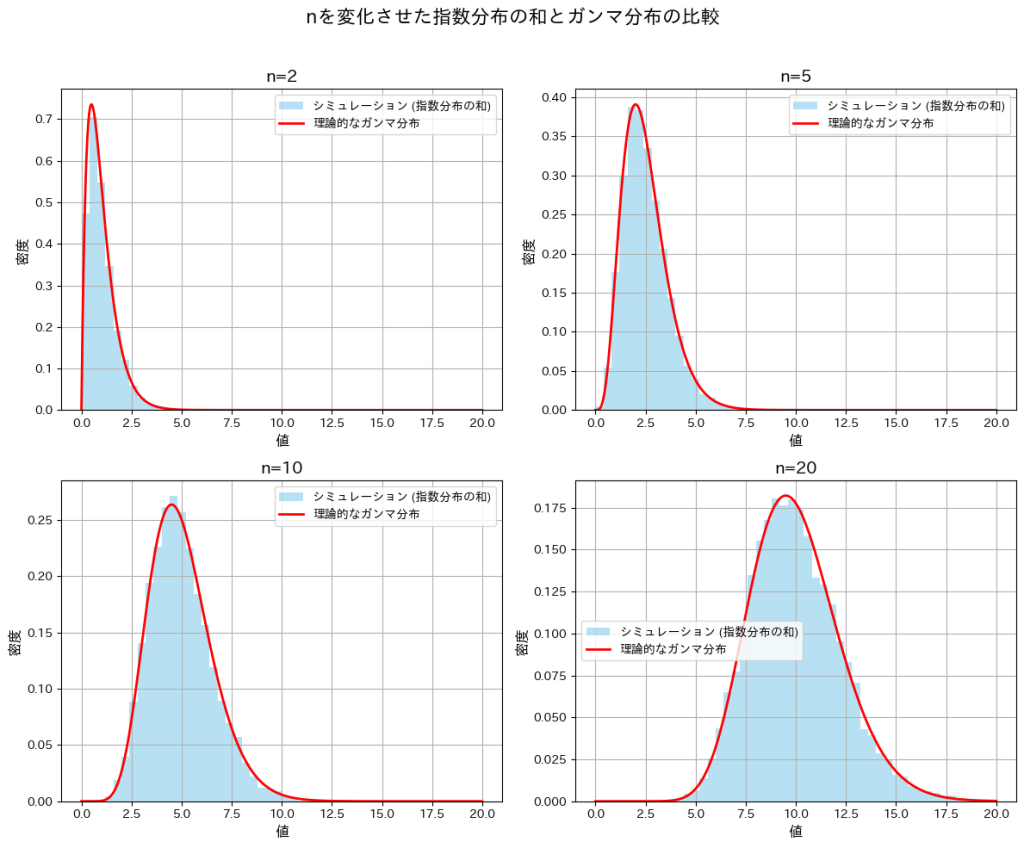
nが小さいときは分布が右に裾が長くなり、nが大きくなるにつれて左右対称に近づいています。また、どのnにおいても形状パラメータnのガンマ分布とよく一致していることが確認できました。
2016 Q2(3)
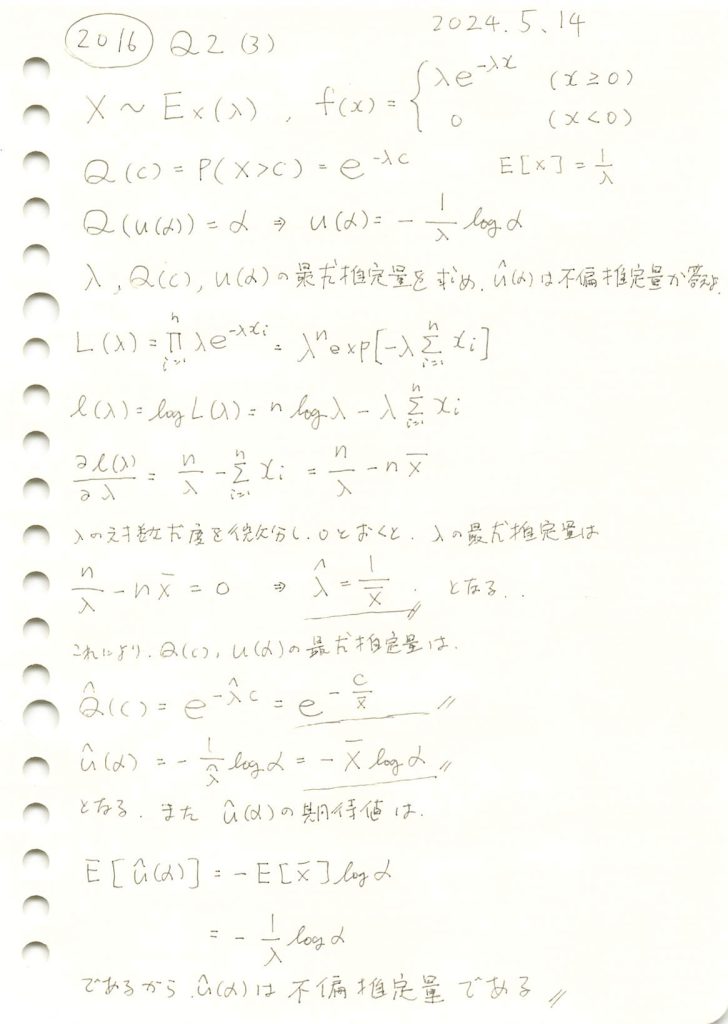
指数分布のλと、上側α点を返す関数の最尤推定量を求め、不偏であるか確認しました。
コード
最尤推定量![]() をシミュレーションし、理論値
をシミュレーションし、理論値![]() と比較します。共にグラフに描画し、どの程度一致しているか確認します。
と比較します。共にグラフに描画し、どの程度一致しているか確認します。
# 2016 Q2(3) 2024.11.17

import numpy as np
import matplotlib.pyplot as plt

# パラメータ設定
lambda_value = 2  # 真のλ
n = 100  # サンプル数
c = 1.0  # Q(c) を計算するための c の値
alpha_values = [0.1, 0.25, 0.5, 0.75, 0.9]  # αの値

# 1. 指数分布からサンプルを生成
samples = np.random.exponential(scale=1/lambda_value, size=n)

# 2. λの最尤推定量を計算
lambda_hat = n / np.sum(samples)

# 3. Q(c) の最尤推定量を計算
Q_hat_c = np.exp(-lambda_hat * c)
Q_theoretical_c = np.exp(-lambda_value * c)

# 4. u(α) の最尤推定量を計算
u_hat_alpha = [-np.mean(samples) * np.log(alpha) for alpha in alpha_values]
u_theoretical_alpha = [-np.log(alpha) / lambda_value for alpha in alpha_values]

# グラフ作成部分
plt.figure(figsize=(10, 6))

# 理論値と最尤推定量の u(α) をプロット
plt.plot(alpha_values, u_theoretical_alpha, 'r-o', label='u(α) 理論値', linewidth=2)
plt.plot(alpha_values, u_hat_alpha, 'b--s', label='u(α) 最尤推定量', linewidth=2)  # 'b--s' で破線とマーカーを指定

# グラフの設定
plt.title('u(α) の理論値と最尤推定量の比較', fontsize=16)
plt.xlabel('α', fontsize=14)
plt.ylabel('u(α)', fontsize=14)
plt.legend(fontsize=12)
plt.grid(True)
plt.xticks(alpha_values)

# グラフの表示
plt.show()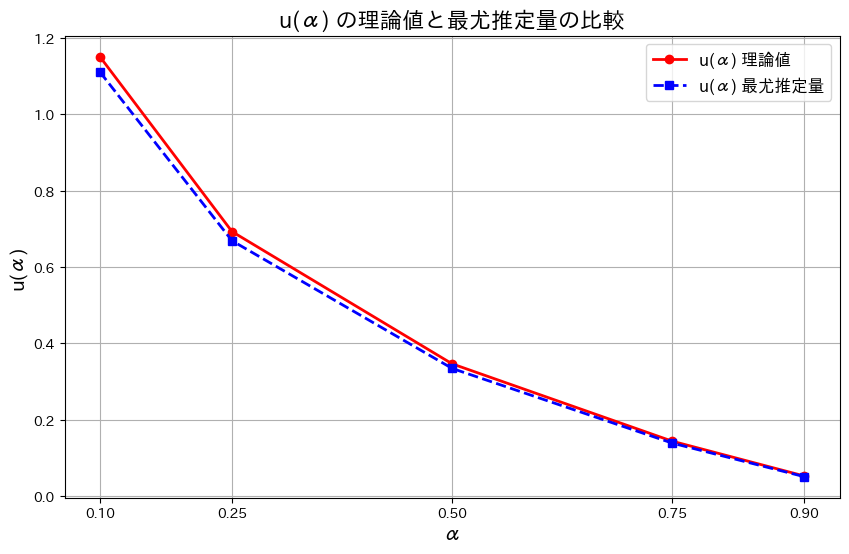
![]() はわずかに誤差があるものの概ね一致しました。また誤差はαが大きくなるにつれて小さくなります。その理由は、αが大きくなるとu(α)の値が小さくなり、分布の高密度な部分にサンプルが集中するためと考えられます。
はわずかに誤差があるものの概ね一致しました。また誤差はαが大きくなるにつれて小さくなります。その理由は、αが大きくなるとu(α)の値が小さくなり、分布の高密度な部分にサンプルが集中するためと考えられます。
2016 Q2(2)
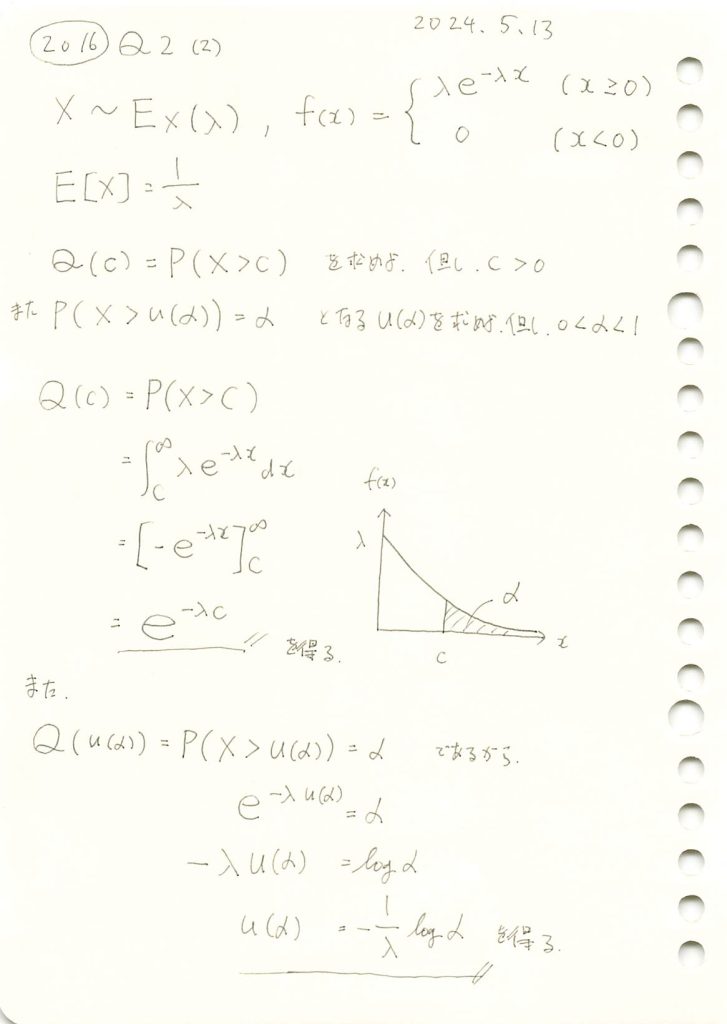
指数分布の上側α点を返す関数を求めました。
コード
パラメータλ=2の指数分布において、Q(c)=P(X>c)をシミュレーションによって求め、理論値と比較します。c=1とします。また、P(X>u(α))=αとなるu(α)も同様に比較します。
# 2016 Q2(2)  2024.11.16

import numpy as np
import matplotlib.pyplot as plt

# パラメータ設定
lambda_value = 2  # λの値
sample_size = 10000  # シミュレーションに使用するサンプル数
c = 1.0  # 上側確率を計算するための定数 c
alpha_values = [0.1, 0.25, 0.5, 0.75, 0.9]  # 上側 100α% 点を確認する α の値

# 1. 上側確率 Q(c) のシミュレーション
random_samples = np.random.exponential(scale=1/lambda_value, size=sample_size)
empirical_prob_c = np.mean(random_samples > c)  # シミュレーションによる上側確率
theoretical_prob_c = np.exp(-lambda_value * c)  # 理論的な上側確率

# 結果表示
print("上側確率 Q(c) のシミュレーション結果")
print(f"理論的な Q(c) = {theoretical_prob_c:.4f}")
print(f"シミュレーションによる Q(c) = {empirical_prob_c:.4f}\n")

# 2. 上側 100α% 点 u(α) の確認
alpha_results = []
for alpha in alpha_values:
    u_alpha = -np.log(alpha) / lambda_value  # 理論的な上側 100α% 点
    empirical_prob_alpha = np.mean(random_samples > u_alpha)  # u(α) を超える割合
    alpha_results.append((alpha, u_alpha, empirical_prob_alpha))

# 結果表示
print("上側 100α% 点 u(α) のシミュレーション結果")
for alpha, u_alpha, empirical_prob_alpha in alpha_results:
    print(f"α = {alpha:.2f} | 理論的な u(α) = {u_alpha:.4f} | 理論的確率P(X>u(α)) = {alpha:.2f} | シミュレーション確率 = {empirical_prob_alpha:.4f}")

# ヒストグラムのプロット
plt.figure(figsize=(10, 6))
plt.hist(random_samples, bins=50, density=True, alpha=0.6, color='skyblue', label='サンプルのヒストグラム')

# 理論的な確率密度関数
x = np.linspace(0, max(random_samples), 1000)
theoretical_pdf = lambda_value * np.exp(-lambda_value * x)
plt.plot(x, theoretical_pdf, 'r-', label='理論的な確率密度関数', linewidth=2)

# 上側 100α% 点 u(α) のプロット
for alpha, u_alpha, _ in alpha_results:
    plt.axvline(u_alpha, linestyle='dashed', label=f'u({alpha}) = {u_alpha:.2f}')

# グラフ設定
plt.title(f'指数分布 Exp({lambda_value}) のシミュレーションと理論分布')
plt.xlabel('x')
plt.ylabel('密度')
plt.legend(fontsize=10)
plt.grid(True)

# プロット表示
plt.show()
上側確率 Q(c) のシミュレーション結果
理論的な Q(c) = 0.1353
シミュレーションによる Q(c) = 0.1365
上側 100α% 点 u(α) のシミュレーション結果
α = 0.10 | 理論的な u(α) = 1.1513 | 理論的確率P(X>u(α)) = 0.10 | シミュレーション確率 = 0.1035
α = 0.25 | 理論的な u(α) = 0.6931 | 理論的確率P(X>u(α)) = 0.25 | シミュレーション確率 = 0.2480
α = 0.50 | 理論的な u(α) = 0.3466 | 理論的確率P(X>u(α)) = 0.50 | シミュレーション確率 = 0.4962
α = 0.75 | 理論的な u(α) = 0.1438 | 理論的確率P(X>u(α)) = 0.75 | シミュレーション確率 = 0.7513
α = 0.90 | 理論的な u(α) = 0.0527 | 理論的確率P(X>u(α)) = 0.90 | シミュレーション確率 = 0.9011
Q(c)=P(X>c)とP(X>u(α))の理論値とシミュレーション結果は非常によく一致しました。
2016 Q2(1)
指数分布の期待値を求めました。
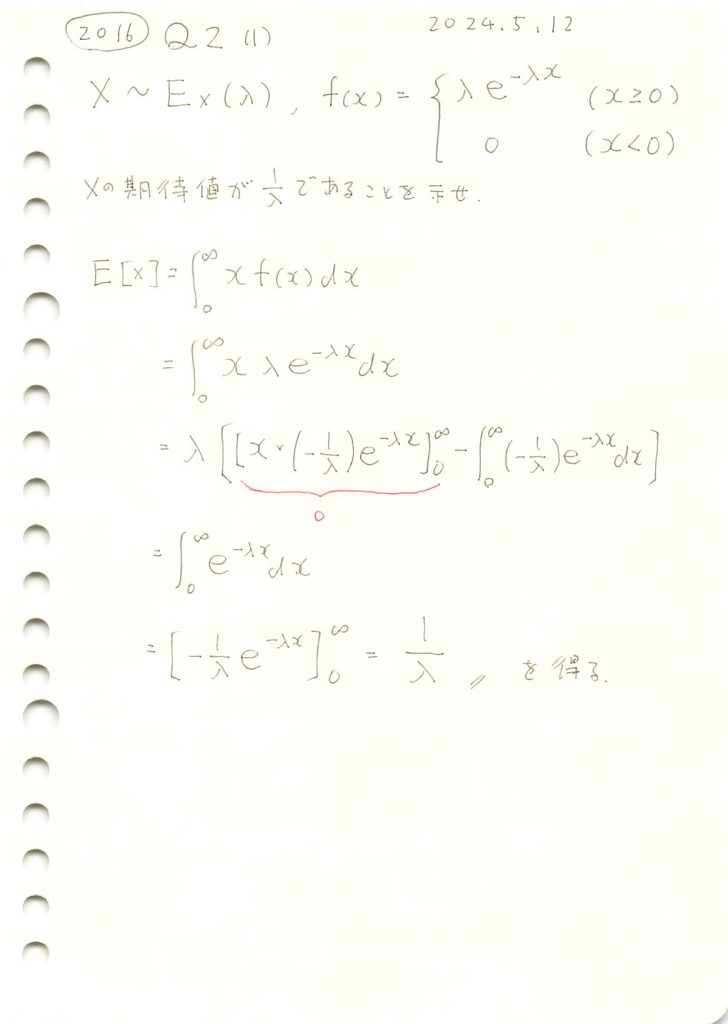
コード
指数分布Exp(λ)に従うXの確率密度関数を![]() とするとき、Xのシミュレーションを行い、その分布のヒストグラムと理論的な確率密度関数のグラフを重ねて描画してみます。λ=2とします。
とするとき、Xのシミュレーションを行い、その分布のヒストグラムと理論的な確率密度関数のグラフを重ねて描画してみます。λ=2とします。
# 2016 Q2(1)  2024.11.15

import numpy as np
import matplotlib.pyplot as plt

# シミュレーションとプロット
def simulate_and_plot_exponential(lambda_value=2, sample_size=50000, bins=100):
    # 指数分布に従う乱数を生成
    random_samples = np.random.exponential(scale=1/lambda_value, size=sample_size)

    # 理論的な確率密度関数を計算
    x = np.linspace(0, 5, 1000)
    theoretical_pdf = lambda_value * np.exp(-lambda_value * x)

    # サンプルのヒストグラムを描画
    plt.figure(figsize=(10, 6))
    plt.hist(random_samples, bins=bins, density=True, alpha=0.6, color='skyblue', label='サンプルのヒストグラム')

    # 理論的な確率密度関数を重ねる
    plt.plot(x, theoretical_pdf, 'r-', label='理論的な確率密度関数', linewidth=2)

    # 期待値を計算
    simulated_mean = np.mean(random_samples)
    theoretical_mean = 1 / lambda_value

    # 期待値を直線でプロット
    plt.axvline(simulated_mean, color='green', linestyle='dashed', linewidth=2, label=f'シミュレーション期待値: {simulated_mean:.2f}')
    plt.axvline(theoretical_mean, color='blue', linestyle='dotted', linewidth=2, label=f'理論期待値: {theoretical_mean:.2f}')

    # グラフの設定
    plt.title(f'指数分布のシミュレーションと理論分布 (λ={lambda_value})', fontsize=16)
    plt.xlabel('x', fontsize=14)
    plt.ylabel('密度', fontsize=14)
    plt.legend(fontsize=12)
    plt.grid(True)

    # プロットを表示
    plt.show()

# 実行
simulate_and_plot_exponential()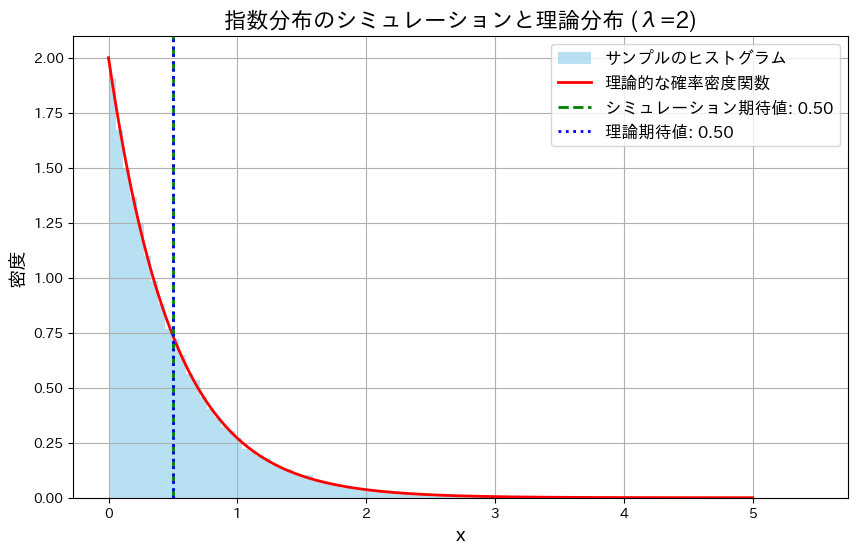
Xの分布は、確率密度関数![]() とよく一致しており、シミュレーションで得られた期待値も理論値に非常に近い値となりました。
とよく一致しており、シミュレーションで得られた期待値も理論値に非常に近い値となりました。
では、次にλを変化させて同様の実験を行い、グラフの形状の変化と期待値がどのように変化するかを確認します。
# 2016 Q2(1)  2024.11.15

import numpy as np
import matplotlib.pyplot as plt

# シミュレーションとプロット
def simulate_and_plot_adjusted_lambdas(lambdas=[0.5, 1, 2, 3], sample_size=50000, bins=100):
    fig, axes = plt.subplots(2, 2, figsize=(12, 10), sharex=True, sharey=True)
    x = np.linspace(0, 6, 1000)  # 横軸の範囲を0~6に限定

    for i, lambda_value in enumerate(lambdas):
        row, col = divmod(i, 2)
        ax = axes[row, col]

        # 乱数生成と理論値計算
        random_samples = np.random.exponential(scale=1/lambda_value, size=sample_size)
        theoretical_pdf = lambda_value * np.exp(-lambda_value * x)

        # ヒストグラムと理論分布
        ax.hist(random_samples, bins=bins, range=(0, 6), density=True, alpha=0.6, color='skyblue', label='サンプルのヒストグラム')
        ax.plot(x, theoretical_pdf, 'r-', label='理論的な確率密度関数', linewidth=2)

        # 期待値を計算してプロット
        simulated_mean = np.mean(random_samples)
        theoretical_mean = 1 / lambda_value
        ax.axvline(simulated_mean, color='green', linestyle='dashed', linewidth=2, label=f'シミュレーション期待値: {simulated_mean:.2f}')
        ax.axvline(theoretical_mean, color='blue', linestyle='dotted', linewidth=2, label=f'理論期待値: {theoretical_mean:.2f}')

        # グラフ設定
        ax.set_xlim(0, 6)  # 横軸を0~6に限定
        ax.set_title(f'λ={lambda_value}', fontsize=14)
        ax.set_xlabel('x', fontsize=12)
        ax.set_ylabel('密度', fontsize=12)
        ax.legend(fontsize=10)
        ax.grid(True)

    # 全体のタイトルと調整
    plt.suptitle('異なるλにおける指数分布のシミュレーションと理論分布', fontsize=16)
    plt.tight_layout(rect=[0, 0, 1, 0.96])  # タイトルとの重なり防止
    plt.show()

# 実行
simulate_and_plot_adjusted_lambdas()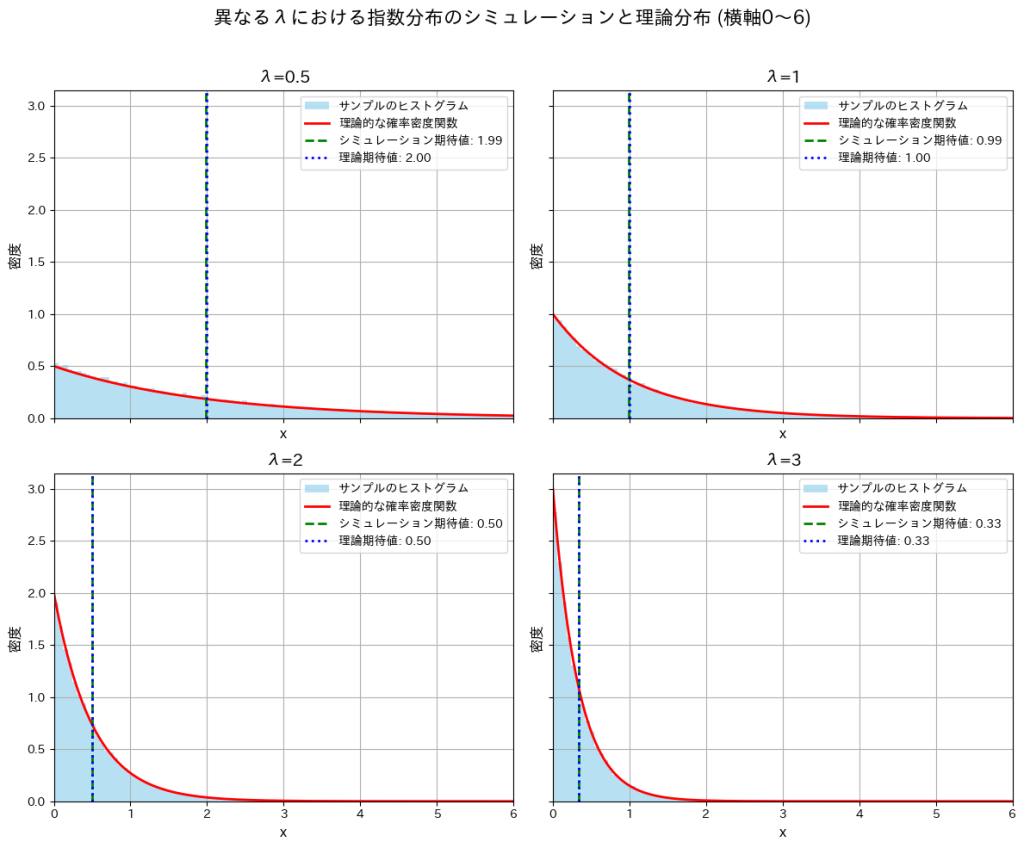
λが大きくなるにつれて分布の形状は急こう配になり期待値が小さくなることが確認できました。λの増加によって小さい値が観測される確率が高くなるためだと考えられます。
2016 Q1(4)
正規分布の母平均μに対してθ=exp(μ)をパラメータとする尤度関数からフィッシャー情報量を求め、その逆数が不偏推定量の分散と一致するか否かを確かめた。
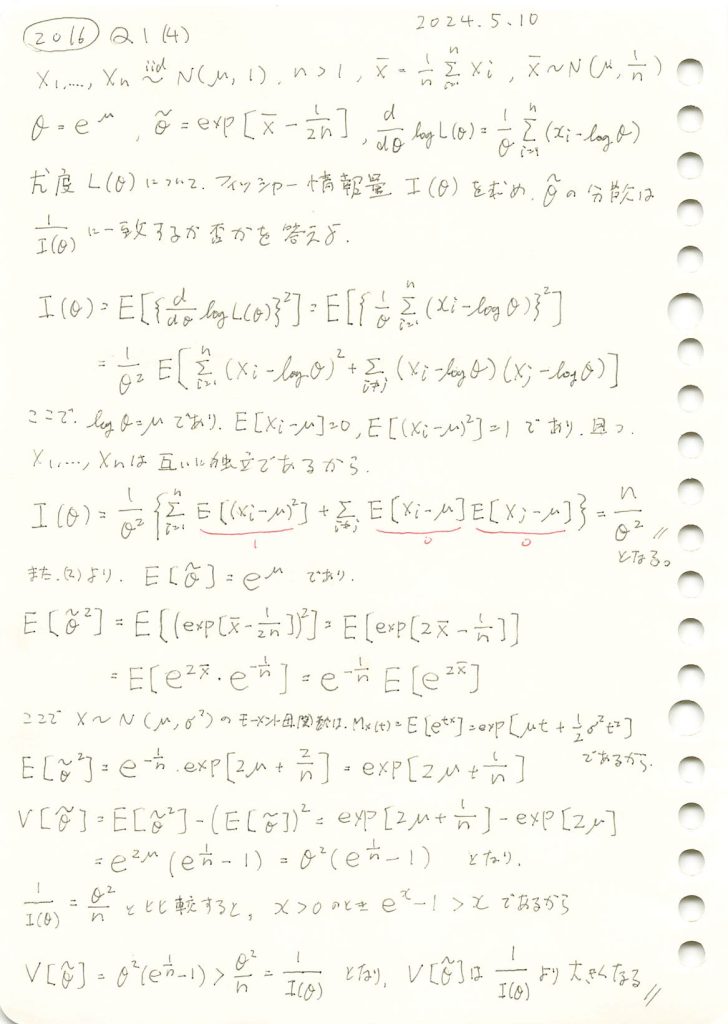
コード
![]() となることを確認するために、両辺をグラフで比較してみます。
となることを確認するために、両辺をグラフで比較してみます。
# 2016 Q1(4)  2024.11.14

import numpy as np
import matplotlib.pyplot as plt

# θ の範囲設定
theta_values = np.linspace(0.1, 5.0, 10)  # 0.1から5.0までの範囲で計算
n_samples = 50  # サンプルサイズ

# 分散 V[θ~] と 1/I(θ) の計算
V_theta_tilde = theta_values**2 * (np.exp(1 / n_samples) - 1)
Fisher_info_inverse = theta_values**2 / n_samples  # 1 / I(θ)

# 折れ線グラフの描画
plt.figure(figsize=(10, 6))
plt.plot(theta_values, V_theta_tilde, label=r'$V[\tilde{\theta}]$ (不偏推定量の分散)', color='blue', linestyle='-', marker='o')
plt.plot(theta_values, Fisher_info_inverse, label=r'$1/I(\theta)$ (フィッシャー情報量の逆数)', color='red', linestyle='--', marker='s')
plt.title('不偏推定量の分散とフィッシャー情報量の逆数の比較', fontsize=16)
plt.xlabel(r'$\theta$', fontsize=14)
plt.ylabel('分散', fontsize=14)
plt.legend(fontsize=12)
plt.grid(True, linestyle='--', alpha=0.7)
plt.show()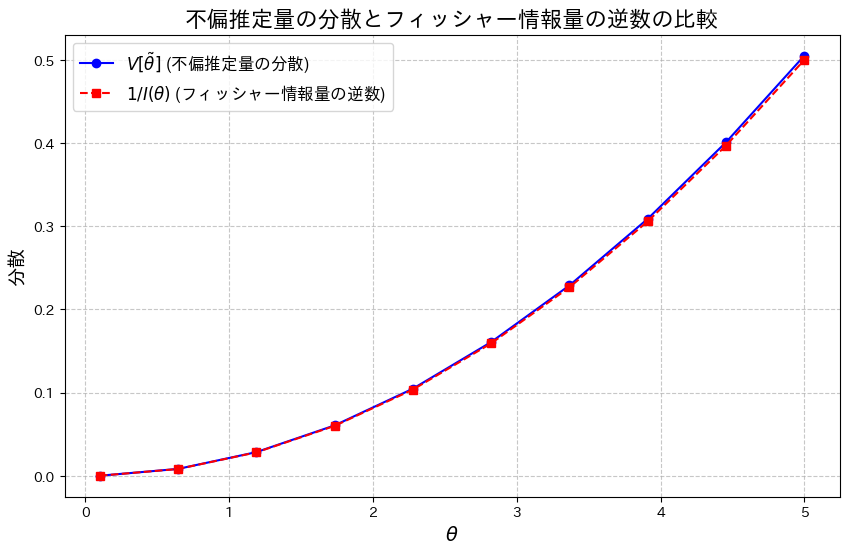
わずかに![]() となっているようです。
となっているようです。
次に、2式の差![]() をプロットし、その差を確認してみます。
をプロットし、その差を確認してみます。
# 2016 Q1(4)  2024.11.14

import numpy as np
import matplotlib.pyplot as plt

# θ の範囲設定
theta_values = np.linspace(0.1, 5.0, 10)  # 0.1から5.0までの範囲で計算
n_samples = 50  # サンプルサイズ

# 分散 V[θ~] と 1/I(θ) の計算
V_theta_tilde = theta_values**2 * (np.exp(1 / n_samples) - 1)
Fisher_info_inverse = theta_values**2 / n_samples  # 1 / I(θ)

# V[θ~] - 1/I(θ) を計算
diff_V_Fisher = V_theta_tilde - Fisher_info_inverse

# 差分をプロット
plt.figure(figsize=(10, 6))
plt.plot(theta_values, diff_V_Fisher, color='purple', linestyle='-', marker='o', label=r'$V[\tilde{\theta}] - \frac{1}{I(\theta)}$')
plt.title('不偏推定量の分散とフィッシャー情報量逆数の差', fontsize=16)
plt.xlabel(r'$\theta$', fontsize=14)
plt.ylabel(r'$V[\tilde{\theta}] - \frac{1}{I(\theta)}$', fontsize=14)
plt.axhline(0, color='black', linestyle='--', linewidth=1)  # y=0 の線を追加
plt.legend(fontsize=12)
plt.grid(True, linestyle='--', alpha=0.7)
plt.show()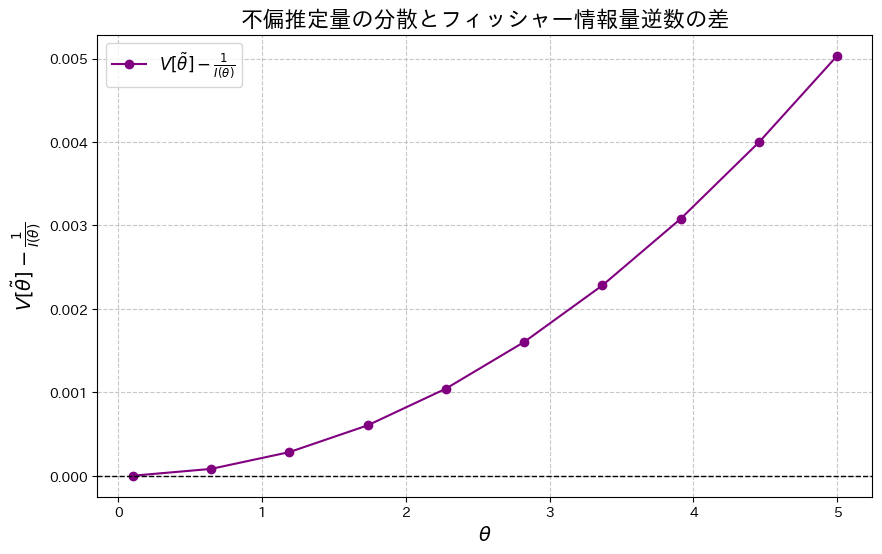
2式の差![]() が存在することが確認できました。この差は、θが増加するにつれて大きくなる傾向が見られます。
が存在することが確認できました。この差は、θが増加するにつれて大きくなる傾向が見られます。
次に、乱数を用いたシミュレーションを行い、![]() を重ねてプロットしてみます。
を重ねてプロットしてみます。
# 2016 Q1(4)  2024.11.14

import numpy as np
import matplotlib.pyplot as plt

# 再定義:thetaの範囲
theta_values = np.linspace(0.1, 5.0, 100)
n_samples = 50
n_trials = 10000  # シミュレーション試行回数

# 理論分散 V[θ~] と 1/I(θ) の計算
V_theta_tilde = theta_values**2 * (np.exp(1 / n_samples) - 1)
Fisher_info_inverse = theta_values**2 / n_samples

# シミュレーションによる分散の再計算
simulated_V_theta_tilde = []

for theta in theta_values:
    mse_trials = []

    for _ in range(n_trials):
        sample = np.random.normal(loc=np.log(theta), scale=1, size=n_samples)  # 平均 log(theta), 分散 1
        X_bar = np.mean(sample)
        theta_tilde = np.exp(X_bar - 1 / (2 * n_samples))  # 不偏推定量
        mse_trials.append((theta_tilde - theta)**2)  # 二乗誤差

    simulated_var = np.mean(mse_trials)  # シミュレーションによる分散 (MSE)
    simulated_V_theta_tilde.append(simulated_var)

# グラフの描画
plt.figure(figsize=(10, 6))
plt.plot(theta_values, V_theta_tilde, label='理論分散 $V[\\tilde{\\theta}]$', linestyle='-', color='blue', alpha=0.7)
plt.scatter(theta_values, simulated_V_theta_tilde, label='シミュレーション分散 $V[\\tilde{\\theta}]$', marker='s', color='red', alpha=0.6)
plt.plot(theta_values, Fisher_info_inverse, label='$1/I(\\theta)$ (フィッシャー情報量の逆数)', linestyle='--', color='green', alpha=0.8)
plt.title('不偏推定量の分散とフィッシャー情報量の逆数の比較', fontsize=16)
plt.xlabel('$\\theta$', fontsize=14)
plt.ylabel('分散', fontsize=14)
plt.legend(fontsize=12)
plt.grid(True, linestyle='--', alpha=0.7)
plt.show()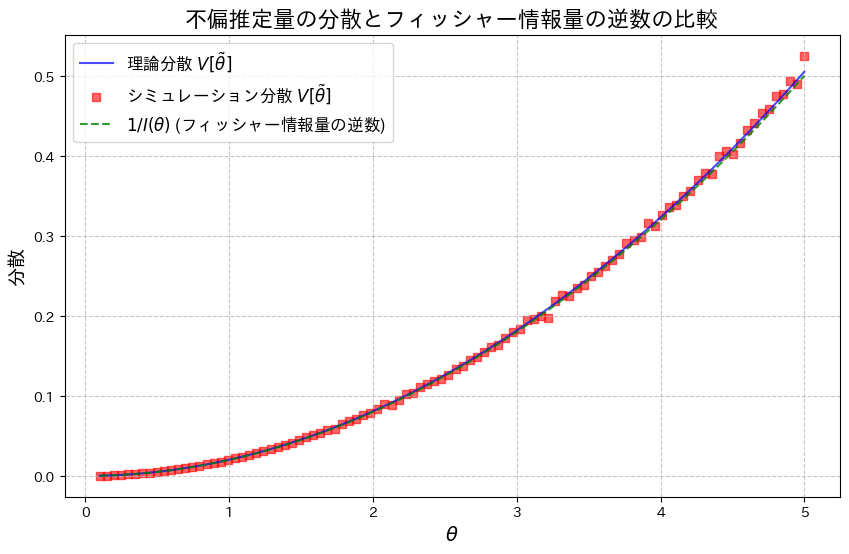
![]() は、わずかに
は、わずかに![]() を下回る場合があるようです。これは、シミュレーションにおける乱数の誤差によるものだと考えられます。
を下回る場合があるようです。これは、シミュレーションにおける乱数の誤差によるものだと考えられます。
2016 Q1(3)
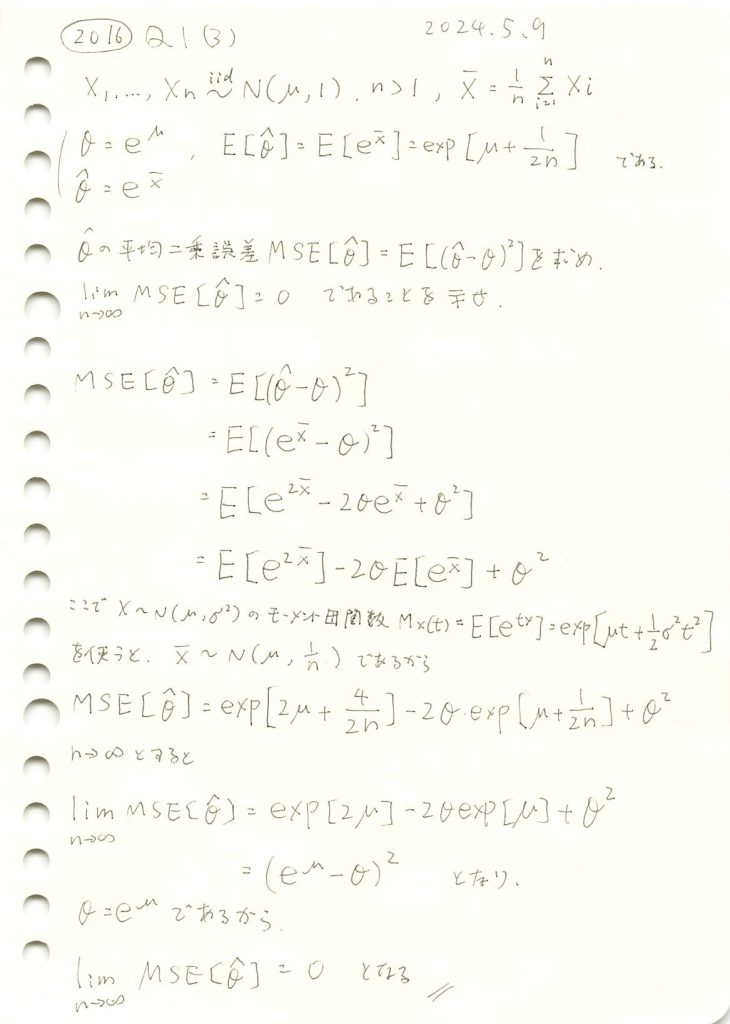
正規分布の母平均μに対するθ=exp(μ)の最尤推定量の平均二乗誤差が0になることを示しました。
コード
シミュレーションを行います。![]() に対して、
に対して、![]() を計算し、理論値とともにプロットします。サンプルサイズnを増加させて、MSEの変化を観察します。
を計算し、理論値とともにプロットします。サンプルサイズnを増加させて、MSEの変化を観察します。
# 2016 Q1(3)  2024.11.13

import numpy as np
import matplotlib.pyplot as plt

# 真の値とシミュレーション設定
mu_true = 1.0  # 真の平均 (mu)
theta_true = np.exp(mu_true)  # 真の θ = e^mu
n_trials = 10000  # シミュレーション試行回数
sample_sizes = np.arange(5, 101, 5)  # サンプルサイズの範囲

# MSEを格納するリスト
mse_simulated = []

# 理論的なMSEの計算関数
def theoretical_mse(n, mu):
    return np.exp(2 * mu) * (np.exp(2 / n) - 2 * np.exp(1 / (2 * n)) + 1)

mse_theoretical = [theoretical_mse(n, mu_true) for n in sample_sizes]

# シミュレーションでのMSE計算
for n_samples in sample_sizes:
    mse_trials = []

    for _ in range(n_trials):

        sample = np.random.normal(loc=mu_true, scale=1, size=n_samples)
        X_bar = np.mean(sample)

        theta_hat = np.exp(X_bar)  # 最尤推定量
        mse_trials.append((theta_hat - theta_true) ** 2)  # MSEの計算

    mse_simulated.append(np.mean(mse_trials))  # 試行平均を格納

# グラフの描画
plt.figure(figsize=(10, 6))
plt.plot(sample_sizes, mse_simulated, marker='o', linestyle='-', color='blue', label='シミュレーション MSE')
plt.plot(sample_sizes, mse_theoretical, marker='s', linestyle='--', color='red', label='理論的 MSE')
plt.title('MSEのシミュレーションと理論値', fontsize=16)
plt.xlabel('サンプルサイズ $n$', fontsize=14)
plt.ylabel('MSE', fontsize=14)
plt.legend(fontsize=12)
plt.grid(True)
plt.show()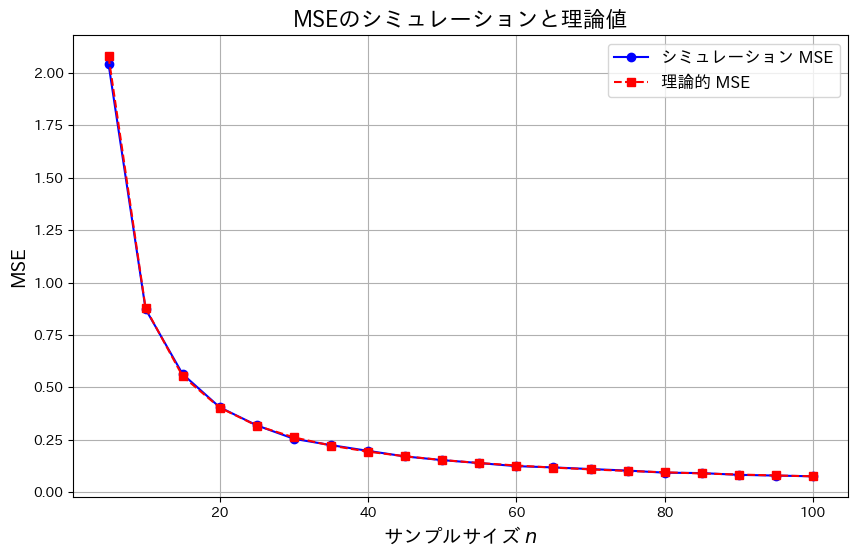
サンプルサイズnが増加するにつれて、![]() は0に近づきました。これにより、
は0に近づきました。これにより、![]() になることが理論とシミュレーションの両方で確認できました。また、この結果から最尤推定量
になることが理論とシミュレーションの両方で確認できました。また、この結果から最尤推定量 ![]() が漸近的一致性を持つことが分かりました。
が漸近的一致性を持つことが分かりました。
2016 Q1(2)
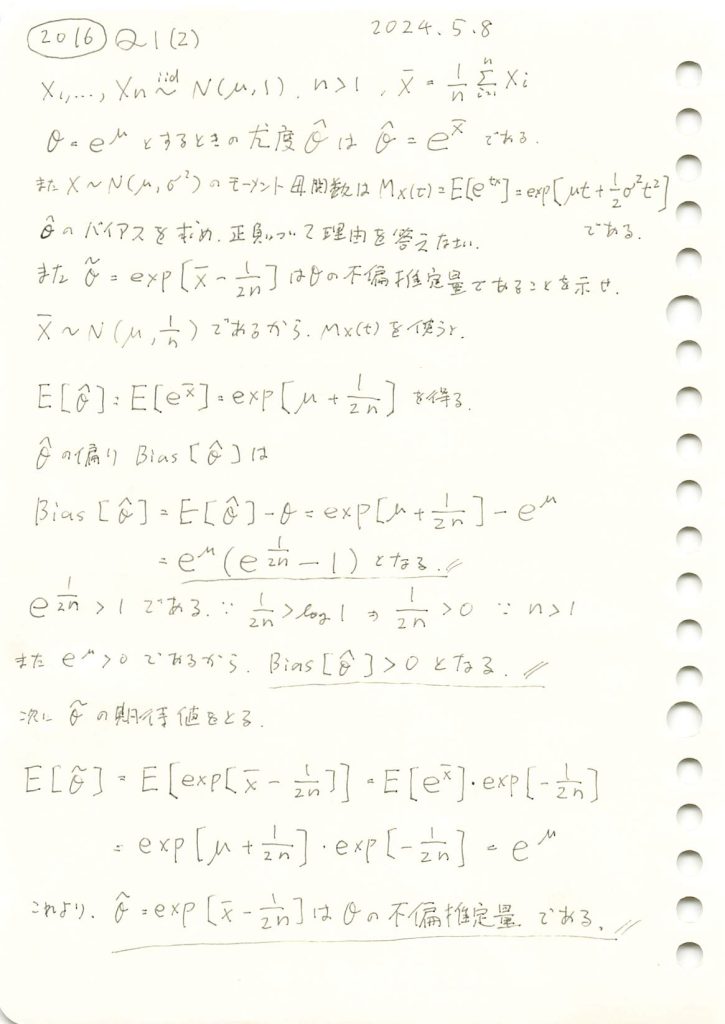
正規分布の母平均μに対してθ=exp(μ)をパラメータとする最尤推定量のバイアスを調べて、与式がθの不偏推定量であることを示しました。
コード
![]() と
と![]() が真のθに近づくか確認するため、シミュレーションを行います。まずはサンプルサイズn=5で試してみます。
が真のθに近づくか確認するため、シミュレーションを行います。まずはサンプルサイズn=5で試してみます。
# 2016 Q1(2)  2024.11.12

import numpy as np
import matplotlib.pyplot as plt

# シミュレーションのパラメータ
mu_true = 1.0  # 真の平均 (mu)
theta_true = np.exp(mu_true)  # 真の θ = e^mu
n_samples = 5  # サンプルサイズ
n_trials = 100000  # シミュレーション試行回数

# 乱数生成と推定量の計算
theta_hat_estimates = []
theta_tilde_estimates = []

for _ in range(n_trials):
    sample = np.random.normal(loc=mu_true, scale=1/np.sqrt(n_samples), size=n_samples)
    X_bar = np.mean(sample)  # 標本平均

    # 最尤推定量 θ^
    theta_hat = np.exp(X_bar)
    theta_hat_estimates.append(theta_hat)

    # 不偏推定量 θ~
    theta_tilde = np.exp(X_bar - 1/(2*n_samples))
    theta_tilde_estimates.append(theta_tilde)

# 推定量の平均を計算
theta_hat_mean = np.mean(theta_hat_estimates)
theta_tilde_mean = np.mean(theta_tilde_estimates)

# グラフ描画
plt.figure(figsize=(12, 6))

# ヒストグラムの描画
plt.hist(theta_hat_estimates, bins=100, density=True, alpha=0.6, color='blue', label='$\\hat{\\theta}$ (最尤推定量)')
plt.hist(theta_tilde_estimates, bins=100, density=True, alpha=0.6, color='green', label='$\\tilde{\\theta}$ (不偏推定量)')

# 真の値を赤線で表示
plt.axvline(theta_true, color='red', linestyle='dashed', linewidth=2, label=f'真の$\\theta$: {theta_true:.2f}')

# θハットとθチルダの平均をそれぞれ緑線と青線で表示
plt.axvline(theta_hat_mean, color='blue', linestyle='dotted', linewidth=2, label=f'$\\hat{{\\theta}}$平均: {theta_hat_mean:.2f}')
plt.axvline(theta_tilde_mean, color='green', linestyle='dotted', linewidth=2, label=f'$\\tilde{{\\theta}}$平均: {theta_tilde_mean:.2f}')

# グラフのタイトルとラベル
plt.title('$\\hat{\\theta}$ と $\\tilde{\\theta}$ の分布', fontsize=16)
plt.xlabel('$\\theta$', fontsize=14)
plt.ylabel('密度', fontsize=14)
plt.legend(fontsize=12)
plt.grid(True)
plt.show()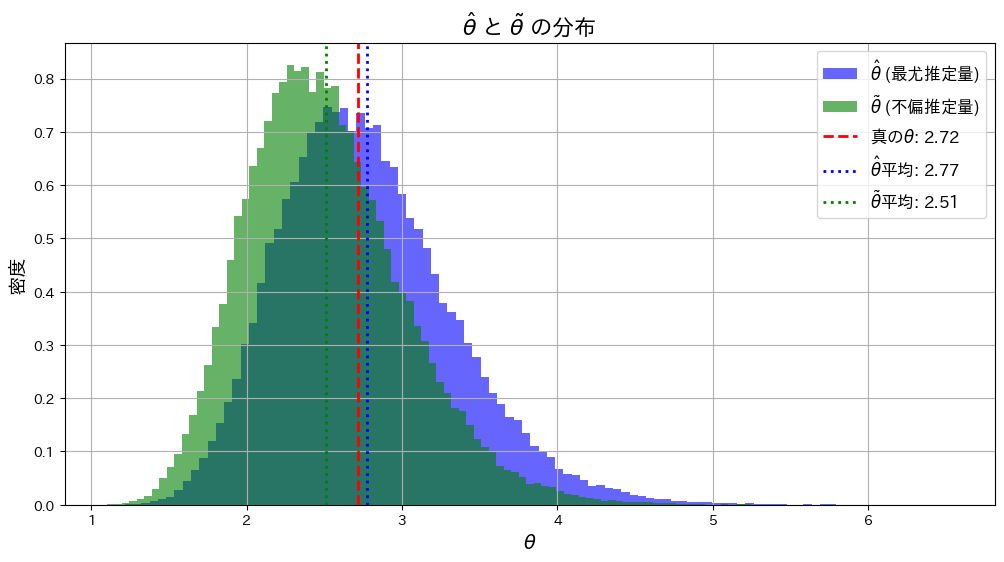
![]() は
は![]() よりも真のθに近くなっています。これはサンプルサイズnが小さいことと、および推定量の分散の違いが起因しているのかもしれません。
よりも真のθに近くなっています。これはサンプルサイズnが小さいことと、および推定量の分散の違いが起因しているのかもしれません。
次に、サンプルサイズn=5, 10, 20, 50と変化させて、この乖離がどのように変わるかを確認します。
# 2016 Q1(2)  2024.11.12

import numpy as np
import matplotlib.pyplot as plt

# シミュレーションのパラメータ
mu_true = 1.0  # 真の平均 (mu)
theta_true = np.exp(mu_true)  # 真の theta = e^mu
n_trials = 100000  # シミュレーション試行回数
sample_sizes = [5, 10, 20, 50]  # サンプルサイズのリスト

fig, axes = plt.subplots(2, 2, figsize=(12, 10))
axes = axes.ravel()  # 2x2 の配列を平坦化

for i, n_samples in enumerate(sample_sizes):
    theta_hat_estimates = []
    theta_tilde_estimates = []

    for _ in range(n_trials):
        sample = np.random.normal(loc=mu_true, scale=1/np.sqrt(n_samples), size=n_samples)
        X_bar = np.mean(sample)

        # 最尤推定量
        theta_hat = np.exp(X_bar)
        theta_hat_estimates.append(theta_hat)

        # 不偏推定量
        theta_tilde = np.exp(X_bar - 1/(2*n_samples))
        theta_tilde_estimates.append(theta_tilde)

    theta_hat_mean = np.mean(theta_hat_estimates)
    theta_tilde_mean = np.mean(theta_tilde_estimates)

    # ヒストグラムのプロット
    axes[i].hist(theta_hat_estimates, bins=100, density=True, alpha=0.6, color='blue', label='$\\hat{\\theta}$ (最尤推定量)')
    axes[i].hist(theta_tilde_estimates, bins=100, density=True, alpha=0.6, color='green', label='$\\tilde{\\theta}$ (不偏推定量)')
    axes[i].axvline(theta_true, color='red', linestyle='dashed', linewidth=2, label=f'真の$\\theta$: {theta_true:.2f}')
    axes[i].axvline(theta_hat_mean, color='blue', linestyle='dotted', linewidth=2, label=f'$\\hat{{\\theta}}$平均: {theta_hat_mean:.2f}')
    axes[i].axvline(theta_tilde_mean, color='green', linestyle='dotted', linewidth=2, label=f'$\\tilde{{\\theta}}$平均: {theta_tilde_mean:.2f}')
    axes[i].set_title(f'サンプルサイズ n={n_samples}')
    axes[i].set_xlabel('$\\theta$')
    axes[i].set_ylabel('密度')
    axes[i].legend()
    axes[i].grid(True)

plt.suptitle('$\\hat{\\theta}$ と $\\tilde{\\theta}$ の分布', fontsize=16)
plt.tight_layout(rect=[0, 0, 1, 0.95])
plt.show()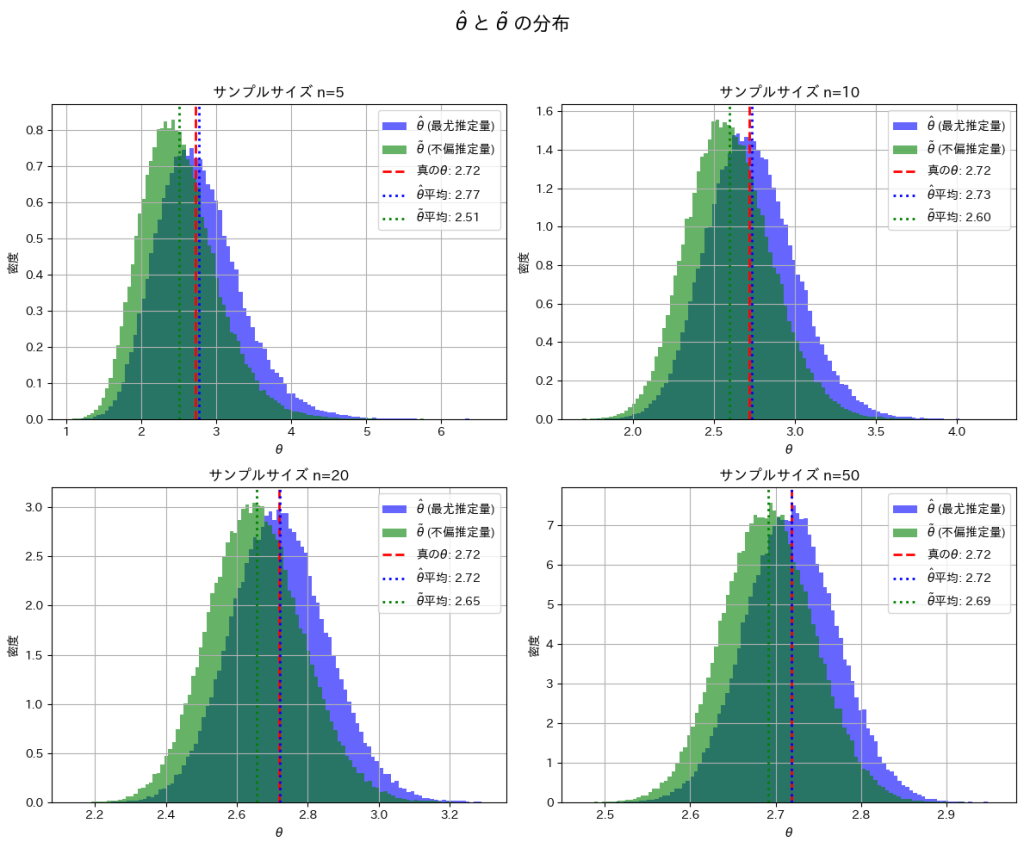
nを大きくすることで、![]() と
と![]() は真のθの間の乖離が小さくなることを確認できました。
は真のθの間の乖離が小さくなることを確認できました。
次に、nを変化させて![]() と
と![]() がどのように変化するか折れ線グラフで見てみます。
がどのように変化するか折れ線グラフで見てみます。
# 2016 Q1(2)  2024.11.12

import numpy as np
import matplotlib.pyplot as plt

# シミュレーションのパラメータ
mu_true = 1.0  # 真の平均 (mu)
theta_true = np.exp(mu_true)  # 真の theta = e^mu
n_trials = 100000  # シミュレーション試行回数
sample_sizes = np.arange(5, 101, 5)  # サンプルサイズ n の範囲 [5, 10, ..., 100]

# 推定量の平均値を格納するリスト
theta_hat_means = []
theta_tilde_means = []

# サンプルサイズを変化させてシミュレーション
for n_samples in sample_sizes:
    theta_hat_estimates = []
    theta_tilde_estimates = []

    for _ in range(n_trials):
        sample = np.random.normal(loc=mu_true, scale=1/np.sqrt(n_samples), size=n_samples)
        X_bar = np.mean(sample)

        # 最尤推定量
        theta_hat = np.exp(X_bar)
        theta_hat_estimates.append(theta_hat)

        # 不偏推定量
        theta_tilde = np.exp(X_bar - 1/(2*n_samples))
        theta_tilde_estimates.append(theta_tilde)

    # 平均値を格納
    theta_hat_means.append(np.mean(theta_hat_estimates))
    theta_tilde_means.append(np.mean(theta_tilde_estimates))

# 折れ線グラフの描画
plt.figure(figsize=(10, 6))
plt.plot(sample_sizes, theta_hat_means, marker='o', linestyle='-', color='blue', label='$\\hat{\\theta}$ (最尤推定量)')
plt.plot(sample_sizes, theta_tilde_means, marker='s', linestyle='-', color='green', label='$\\tilde{\\theta}$ (不偏推定量)')
plt.axhline(y=theta_true, color='red', linestyle='dashed', linewidth=2, label=f'真の$\\theta$: {theta_true:.2f}')

# ラベルとタイトル
plt.title('サンプルサイズ n に対する $\\hat{\\theta}$ と $\\tilde{\\theta}$ の平均値', fontsize=16)
plt.xlabel('サンプルサイズ $n$', fontsize=14)
plt.ylabel('$\\theta$の平均値', fontsize=14)
plt.legend(fontsize=12)
plt.grid(True)
plt.show()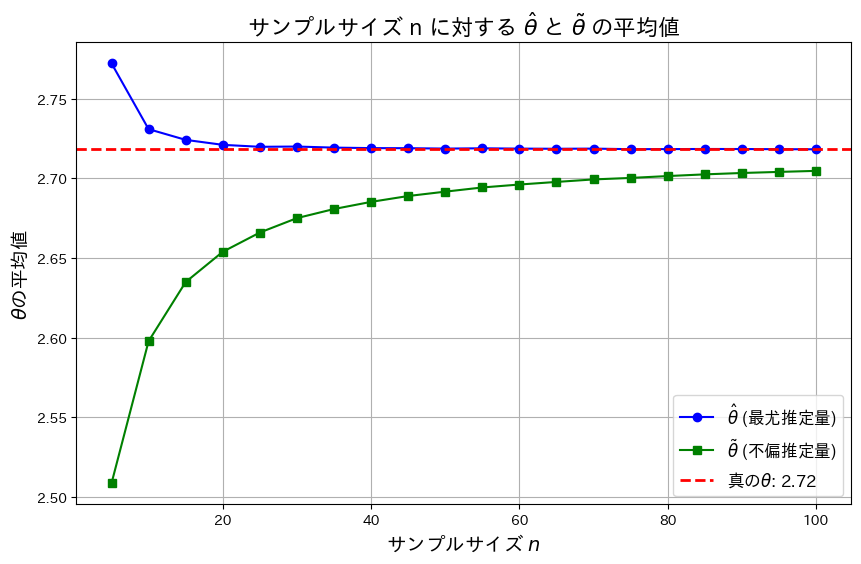
![]() は真のθよりも大きい値を取り、徐々に減少し真のθに近づきます。一方
は真のθよりも大きい値を取り、徐々に減少し真のθに近づきます。一方![]() 真のθよりも小さい値を取り、徐々に増加し真のθに近づきます。また近づくスピードは
真のθよりも小さい値を取り、徐々に増加し真のθに近づきます。また近づくスピードは![]() のほうが早く、
のほうが早く、![]() の分散が
の分散が![]() の分散よりも小さいことが分かります。
の分散よりも小さいことが分かります。
2016 Q1(1)
正規分布の母平均μに対してθ=exp(μ)をパラメータとする最尤推定を行いました。
コード
![]() が真のθに近づくか確認するためシミュレーションを行います。まずはサンプルサイズn=5でやってみます。
が真のθに近づくか確認するためシミュレーションを行います。まずはサンプルサイズn=5でやってみます。
# 2016 Q1(1)  2024.11.11

import numpy as np
import matplotlib.pyplot as plt

# シミュレーションのパラメータ
mu_true = 1.0  # 真の平均 (mu)
theta_true = np.exp(mu_true)  # 真の theta = e^mu
n_samples = 5  # サンプル数
n_trials = 100000  # シミュレーション試行回数

# 乱数生成と最尤推定量の計算
theta_estimates = []

for _ in range(n_trials):
    sample = np.random.normal(loc=mu_true, scale=1, size=n_samples)  # 正規分布からサンプルを生成
    mu_hat = np.mean(sample)  # 平均値を計算 (muの最尤推定量)
    theta_hat = np.exp(mu_hat)  # theta = e^mu の推定値
    theta_estimates.append(theta_hat)

# 真の値とシミュレーションの平均を計算
theta_hat_mean = np.mean(theta_estimates)

# 真の値と推定量の平均値を表示
print(f"真の θ: {theta_true:.4f}")
print(f"θハットの平均値 (シミュレーション): {theta_hat_mean:.4f}")

# グラフの描画
plt.hist(theta_estimates, bins=100, density=True, alpha=0.6, color='blue', label='シミュレーションによる$\hat{\\theta}$')
plt.axvline(theta_true, color='red', linestyle='dashed', linewidth=2, label=f'真の$\\theta$: {theta_true:.2f}')
plt.axvline(theta_hat_mean, color='green', linestyle='dashed', linewidth=2, label=f'$\\hat{{\\theta}}$平均: {theta_hat_mean:.2f}')
plt.title('$\\hat{\\theta}$の分布(最尤推定量)')
plt.xlabel('$\\theta$')
plt.ylabel('密度')
plt.legend()
plt.grid(True)
plt.show()
真の θ: 2.7183
θハットの平均値 (シミュレーション): 3.0120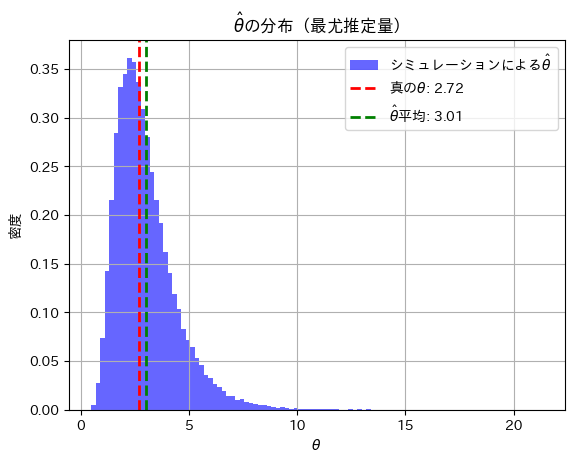
![]() と真のθの間に少し乖離が見られます。サンプルサイズnが小さいことが起因しているかもしれません。
と真のθの間に少し乖離が見られます。サンプルサイズnが小さいことが起因しているかもしれません。
次に、サンプルサイズn=5, 10, 20, 50と変化させて、この乖離がどのように変わるかを確認してみます。
# 2016 Q1(1)  2024.11.11

import numpy as np
import matplotlib.pyplot as plt

# シミュレーションのパラメータ
mu_true = 1.0  # 真の平均 (mu)
theta_true = np.exp(mu_true)  # 真の theta = e^mu
n_trials = 100000  # シミュレーション試行回数
sample_sizes = [5, 10, 20, 50]  # サンプルサイズのリスト

fig, axes = plt.subplots(2, 2, figsize=(12, 10))
axes = axes.ravel()  # 2x2 の配列を平坦化

for i, n_samples in enumerate(sample_sizes):
    theta_estimates = []

    for _ in range(n_trials):
        sample = np.random.normal(loc=mu_true, scale=1, size=n_samples)
        mu_hat = np.mean(sample)
        theta_hat = np.exp(mu_hat)
        theta_estimates.append(theta_hat)

    theta_hat_mean = np.mean(theta_estimates)

    # ヒストグラムのプロット
    axes[i].hist(theta_estimates, bins=100, density=True, alpha=0.6, color='blue', label='シミュレーションによる$\hat{\\theta}$')
    axes[i].axvline(theta_true, color='red', linestyle='dashed', linewidth=2, label=f'真の$\\theta$: {theta_true:.2f}')
    axes[i].axvline(theta_hat_mean, color='green', linestyle='dashed', linewidth=2, label=f'$\\hat{{\\theta}}$平均: {theta_hat_mean:.2f}')
    axes[i].set_title(f'サンプルサイズ n={n_samples}')
    axes[i].set_xlabel('$\\theta$')
    axes[i].set_ylabel('密度')
    axes[i].legend()
    axes[i].grid(True)

plt.suptitle('$\\hat{\\theta}$の分布(最尤推定量)', fontsize=16)
plt.tight_layout(rect=[0, 0, 1, 0.95])
plt.show()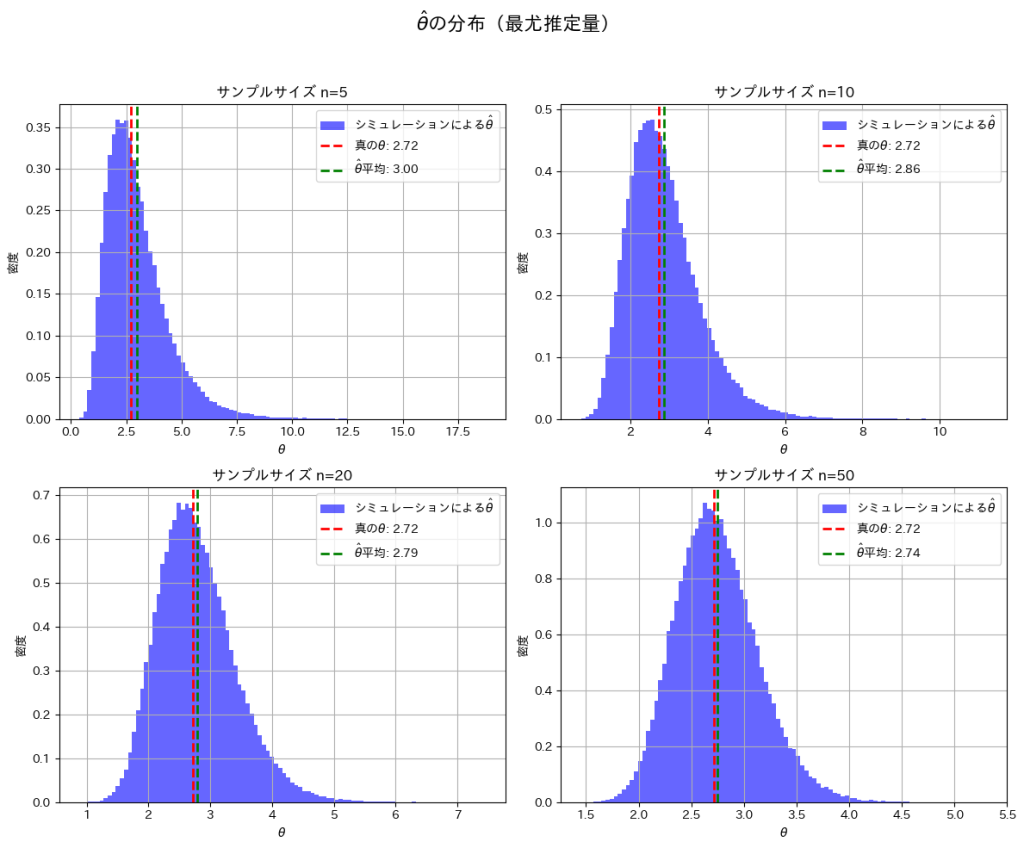
nを大きくすることで、![]() と真のθの間の乖離が小さくなることを確認できました。
と真のθの間の乖離が小さくなることを確認できました。
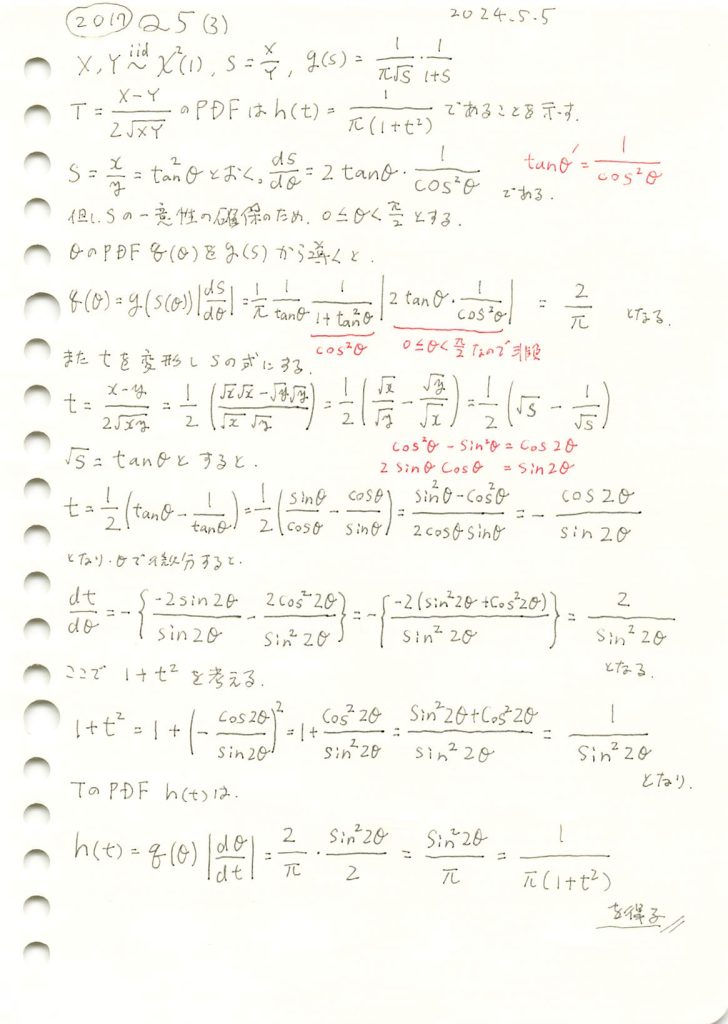
2017 Q5(3)
独立した二つの自由度1のカイ二乗分布の差を幾何平均と2でスケールした式の確率密度関数を導出しました。
コード
Tについてシミュレーションし、確率密度関数![]() と一致するか確認をします。
と一致するか確認をします。
# 2017 Q5(3)  2024.11.10

import numpy as np
import matplotlib.pyplot as plt

# サンプルサイズ
n_samples = 100000

# 自由度1のカイ二乗分布からサンプルを生成
X = np.random.chisquare(df=1, size=n_samples)
Y = np.random.chisquare(df=1, size=n_samples)

# 確率変数 T = (X - Y) / (2 * sqrt(X * Y)) の計算
T = (X - Y) / (2 * np.sqrt(X * Y))

# 理論的な確率密度関数 h(t) の定義
def theoretical_h(t):
    return 1 / (np.pi * (1 + t**2))

# x 軸の範囲を設定し、h(t) を計算
x = np.linspace(-10, 10, 100)
h_t = theoretical_h(x)

# グラフの描画
plt.hist(T, bins=200, density=True, alpha=0.5, range=(-10, 10), label='シミュレーションによる $T$')
plt.plot(x, h_t, 'r-', label='理論的な $h(t) = \\frac{1}{\\pi(1+t^2)}$')
plt.xlabel('$T$')
plt.ylabel('密度')
plt.legend()
plt.title('確率変数 $T$ のシミュレーションと理論密度関数')
plt.show()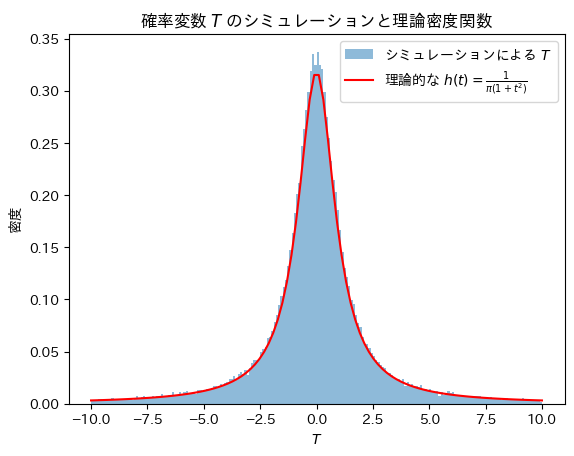
Tの分布は確率密度関数![]() と一致することが確認できました。
と一致することが確認できました。
なお、Tの分布は標準コーシー分布と呼ばれます。