ホーム » コクランの定理
「コクランの定理」カテゴリーアーカイブ
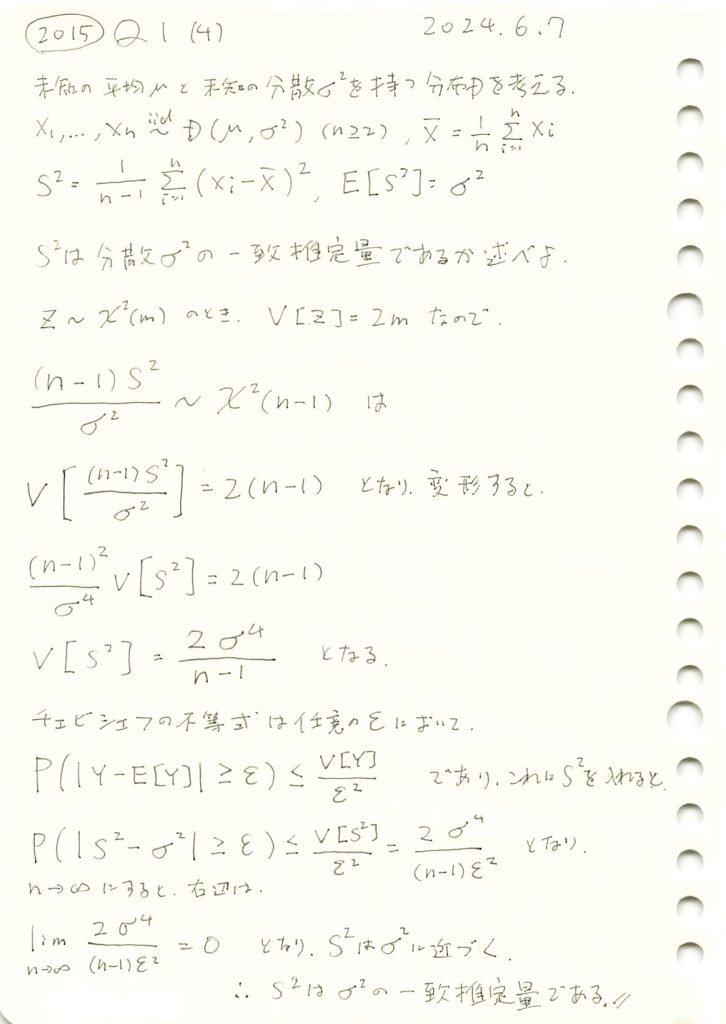
2015 Q1(4)
不偏分散が母分散の一致推定量であることを確認しました。
コード
![]() が
が![]() の一致推定量であるか確認するため、
の一致推定量であるか確認するため、![]() をシミュレーションし、理論値とともにグラフで確認してみます。
をシミュレーションし、理論値とともにグラフで確認してみます。
import numpy as np
import matplotlib.pyplot as plt

# パラメータ設定
mu = 0       # 母平均
sigma2 = 4   # 母分散
sigma = np.sqrt(sigma2)  # 母標準偏差
n_values = [10, 20, 50, 100, 200]  # 標本サイズ
num_simulations = 1000  # シミュレーション回数

# 不偏分散の分散をシミュレーションで計算
simulated_variances = []
theoretical_variances = []

for n in n_values:
    sample_variances = []

    for _ in range(num_simulations):
        sample = np.random.normal(mu, sigma, n)
        unbiased_variance = np.var(sample, ddof=1)  # 不偏分散
        sample_variances.append(unbiased_variance)

    # サンプル分散の分散を計算
    var_of_sample_variance = np.var(sample_variances)
    simulated_variances.append(var_of_sample_variance)

    # 理論値を計算
    theoretical_variance = 2 * sigma2**2 / (n - 1)
    theoretical_variances.append(theoretical_variance)

# グラフの作成
plt.figure(figsize=(10, 6))
plt.plot(n_values, simulated_variances, marker='o', linestyle='-', color='blue', label="シミュレーション値")
plt.plot(n_values, theoretical_variances, marker='o', linestyle='--', color='orange', label="理論値")

# グラフの装飾
plt.title("不偏分散の分散の収束 (シミュレーション vs 理論)")
plt.xlabel("標本サイズ n")
plt.ylabel("分散 (Var[$S^2$])")
plt.grid()
plt.legend()
plt.tight_layout()
plt.show()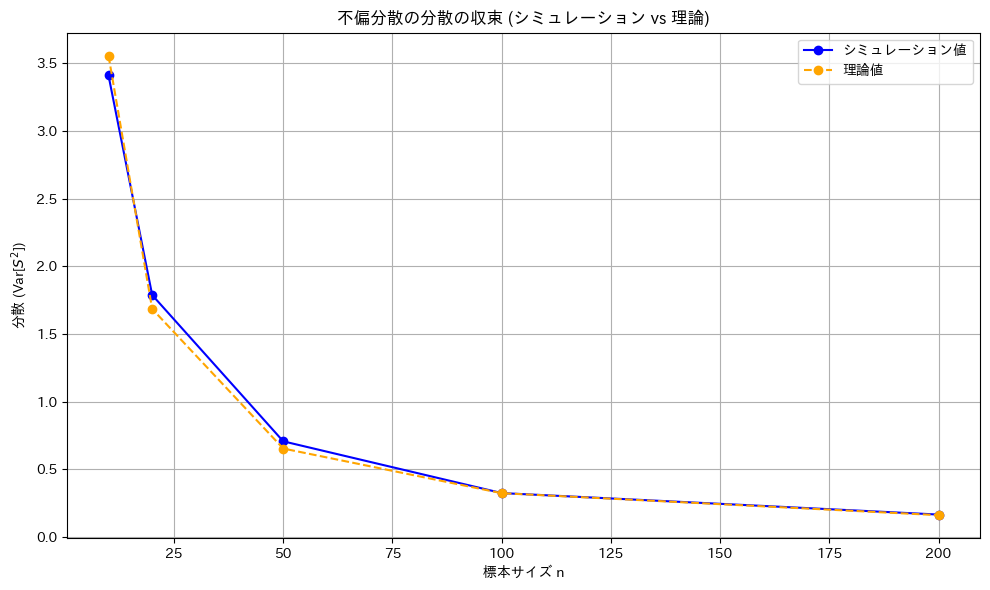
![]() のシミュレーション結果は、理論値
のシミュレーション結果は、理論値![]() とよく一致しました。また、nが増加すると分散が0に近づき、
とよく一致しました。また、nが増加すると分散が0に近づき、![]() が
が![]() の一致推定量であることが確認できました。
の一致推定量であることが確認できました。
2018 Q1(2)-3
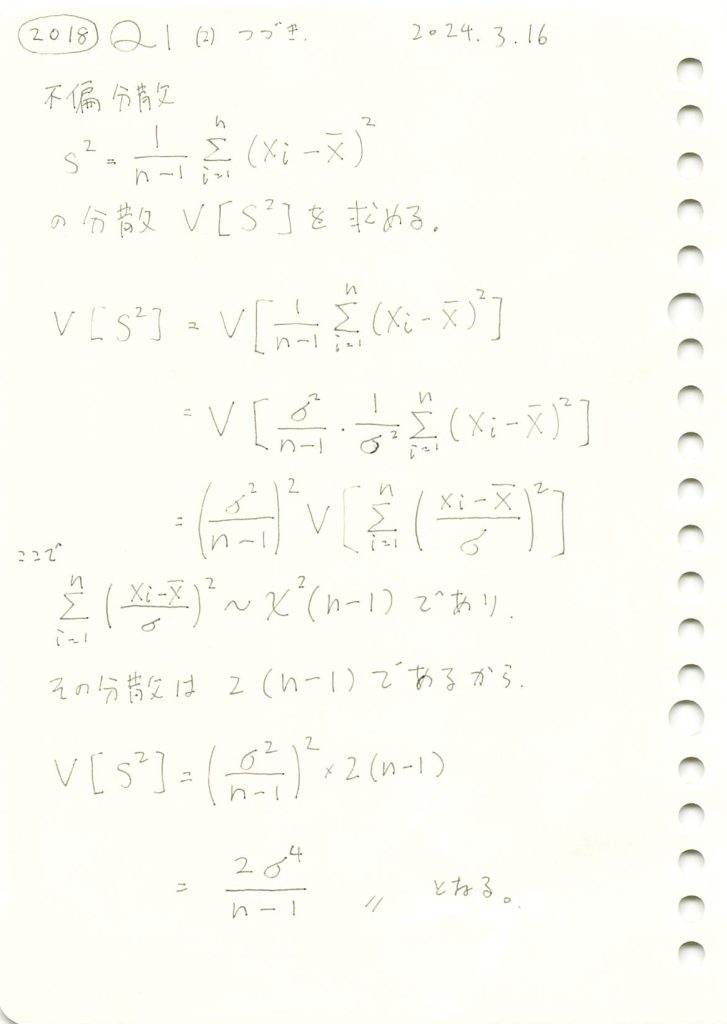
不偏分散の分散を求めました。
コード
数値シミュレーションにより標本分散の分散を求めてみます。
# 2018 Q1(2)  2024.10.2

import numpy as np
import matplotlib.pyplot as plt

# パラメータ設定
sigma = 2   # 母分散の標準偏差
sigma_squared = sigma ** 2  # 母分散
n = 30      # サンプルサイズ
num_simulations = 10000  # シミュレーションの回数

# 理論上の標本分散の分散 Var(S^2)
theoretical_variance = (2 * sigma_squared ** 2) / (n - 1)

# シミュレーション結果を保存するリスト
sample_variances = []

# シミュレーションを繰り返す
for _ in range(num_simulations):
    # 正規分布 N(0, sigma^2) に従うサンプルを生成
    sample = np.random.normal(0, sigma, n)

    # 標本平均
    sample_mean = np.mean(sample)

    # 標本分散 (S^2)
    sample_variance = np.sum((sample - sample_mean) ** 2) / (n - 1)

    # 計算した標本分散をリストに追加
    sample_variances.append(sample_variance)

# サンプル分散の分散を計算
empirical_variance = np.var(sample_variances)

# 結果表示
print(f"理論的な標本分散の分散: {theoretical_variance:.4f}")
print(f"シミュレーションで得られた標本分散の分散: {empirical_variance:.4f}")

# ヒストグラムを描画して標本分散の分布を確認
plt.hist(sample_variances, bins=50, alpha=0.7, color='b', edgecolor='black')
plt.axvline(np.mean(sample_variances), color='r', linestyle='dashed', linewidth=2, label='平均分散')
plt.title('標本分散の分布')
plt.xlabel('標本分散 S^2')
plt.ylabel('頻度')
plt.legend()
plt.grid(True)
plt.show()
理論的な標本分散の分散: 1.1034
シミュレーションで得られた標本分散の分散: 1.1286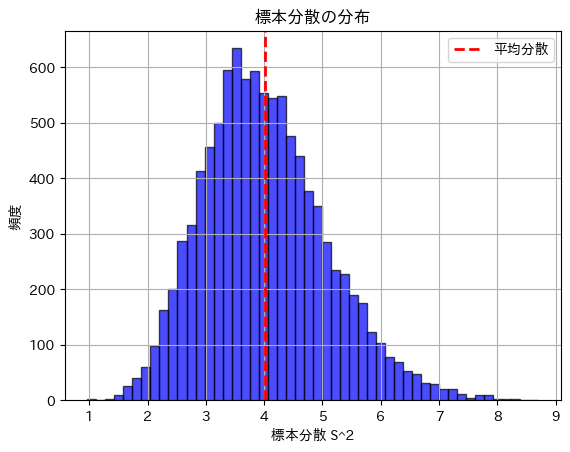
標本分散の分散は理論値に近い値になりました。
2018 Q1(2)-1
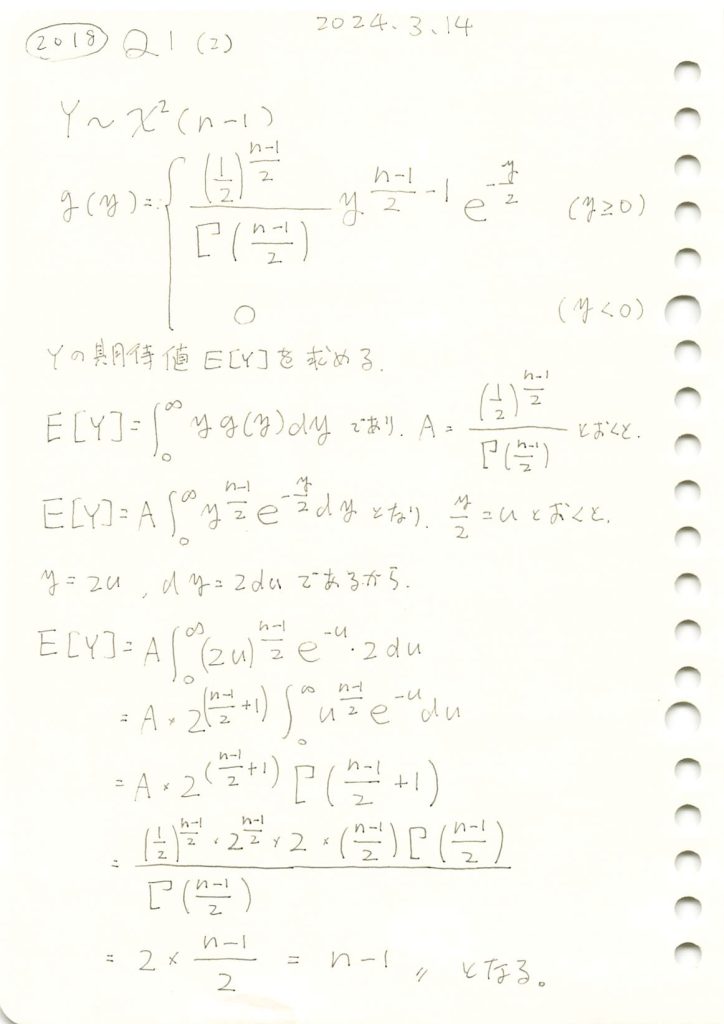
カイ二乗分布の期待値を求めました。
コード
数値シミュレーションにより、n=10(自由度9)のカイ二乗分布の期待値と分散を求めてみます。
# 2018 Q1(2)  2024.10.2

import numpy as np
import matplotlib.pyplot as plt

# パラメータ設定
n = 10  # サンプルサイズ (自由度は n-1)
degrees_of_freedom = n - 1  # 自由度
num_simulations = 10000  # シミュレーションの回数

# カイ二乗分布に従うランダム変数を生成
chi_squared_samples = np.random.chisquare(df=degrees_of_freedom, size=num_simulations)

# 期待値と分散を計算
empirical_mean = np.mean(chi_squared_samples)
empirical_variance = np.var(chi_squared_samples)

# 理論値
theoretical_mean = degrees_of_freedom  # 期待値 E[Y] = n-1
theoretical_variance = 2 * degrees_of_freedom  # 分散 Var(Y) = 2(n-1)

# 結果表示
print(f"カイ二乗分布の期待値 (理論): {theoretical_mean:.4f}")
print(f"カイ二乗分布の期待値 (シミュレーション): {empirical_mean:.4f}")
print(f"カイ二乗分布の分散 (理論): {theoretical_variance:.4f}")
print(f"カイ二乗分布の分散 (シミュレーション): {empirical_variance:.4f}")

# ヒストグラムを描画して確認
plt.hist(chi_squared_samples, bins=50, alpha=0.7, color='b', edgecolor='black')
plt.axvline(empirical_mean, color='r', linestyle='dashed', linewidth=2, label='シミュレーション平均')
plt.axvline(theoretical_mean, color='g', linestyle='dashed', linewidth=2, label='理論平均')
plt.title('カイ二乗分布 (自由度 10-1)')
plt.xlabel('値')
plt.ylabel('頻度')
plt.legend()
plt.grid(True)
plt.show()
カイ二乗分布の期待値 (理論): 9.0000
カイ二乗分布の期待値 (シミュレーション): 8.9728
カイ二乗分布の分散 (理論): 18.0000
カイ二乗分布の分散 (シミュレーション): 18.3530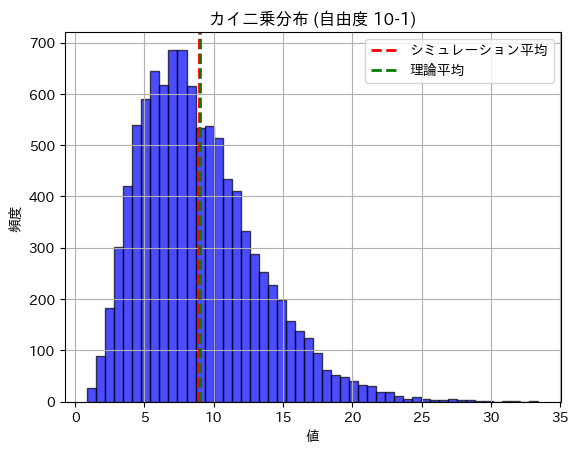
期待値と分散は理論値に近い値になりました。
次に、数値シミュレーションにより標本分散の分散を求めてみます。
# 2018 Q1(2)  2024.10.2

import numpy as np
import matplotlib.pyplot as plt

# パラメータ設定
sigma = 2   # 母分散の標準偏差
sigma_squared = sigma ** 2  # 母分散
n = 30      # サンプルサイズ
num_simulations = 10000  # シミュレーションの回数

# 理論上の標本分散の分散 Var(S^2)
theoretical_variance = (2 * sigma_squared ** 2) / (n - 1)

# シミュレーション結果を保存するリスト
sample_variances = []

# シミュレーションを繰り返す
for _ in range(num_simulations):
    # 正規分布 N(0, sigma^2) に従うサンプルを生成
    sample = np.random.normal(0, sigma, n)

    # 標本平均
    sample_mean = np.mean(sample)

    # 標本分散 (S^2)
    sample_variance = np.sum((sample - sample_mean) ** 2) / (n - 1)

    # 計算した標本分散をリストに追加
    sample_variances.append(sample_variance)

# サンプル分散の分散を計算
empirical_variance = np.var(sample_variances)

# 結果表示
print(f"理論的な標本分散の分散: {theoretical_variance:.4f}")
print(f"シミュレーションで得られた標本分散の分散: {empirical_variance:.4f}")

# ヒストグラムを描画して標本分散の分布を確認
plt.hist(sample_variances, bins=50, alpha=0.7, color='b', edgecolor='black')
plt.axvline(np.mean(sample_variances), color='r', linestyle='dashed', linewidth=2, label='平均分散')
plt.title('標本分散の分布')
plt.xlabel('標本分散 S^2')
plt.ylabel('頻度')
plt.legend()
plt.grid(True)
plt.show()
理論的な標本分散の分散: 1.1034
シミュレーションで得られた標本分散の分散: 1.1286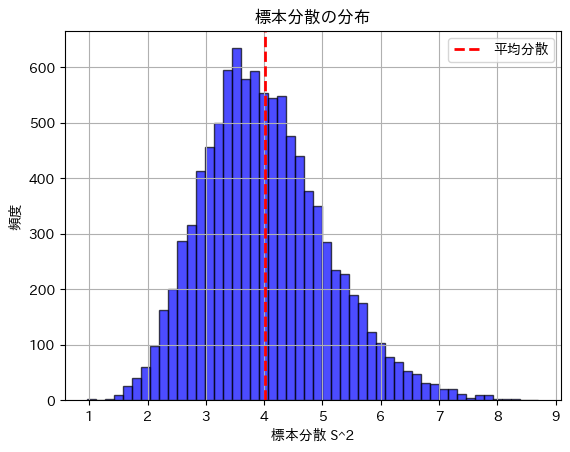
標本分散の分散は理論値に近い値になりました。