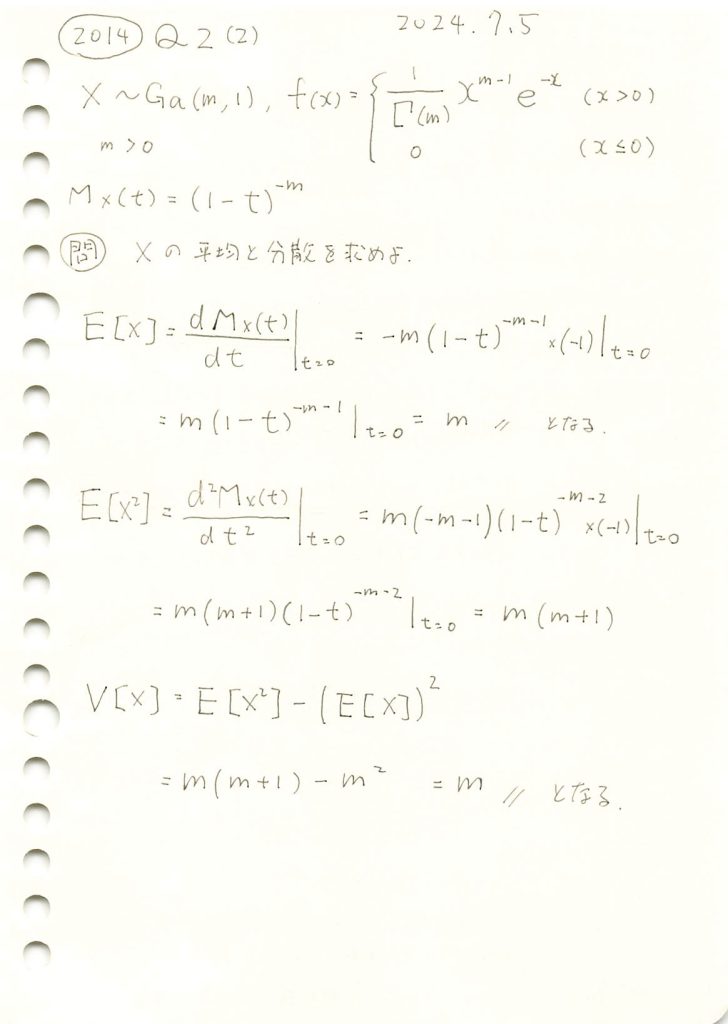
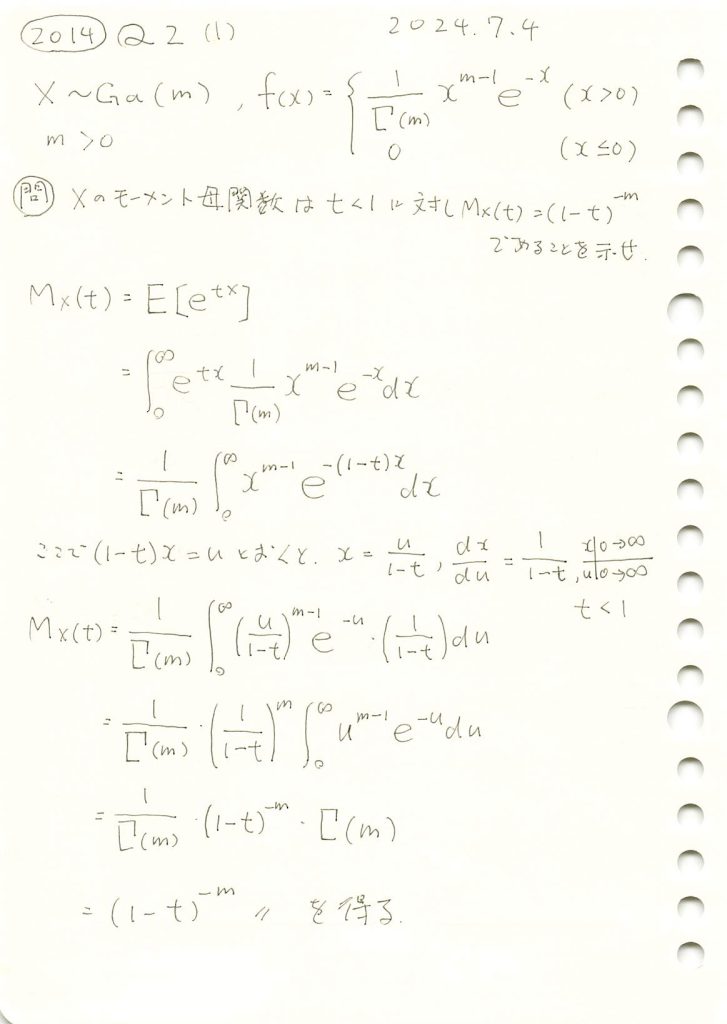
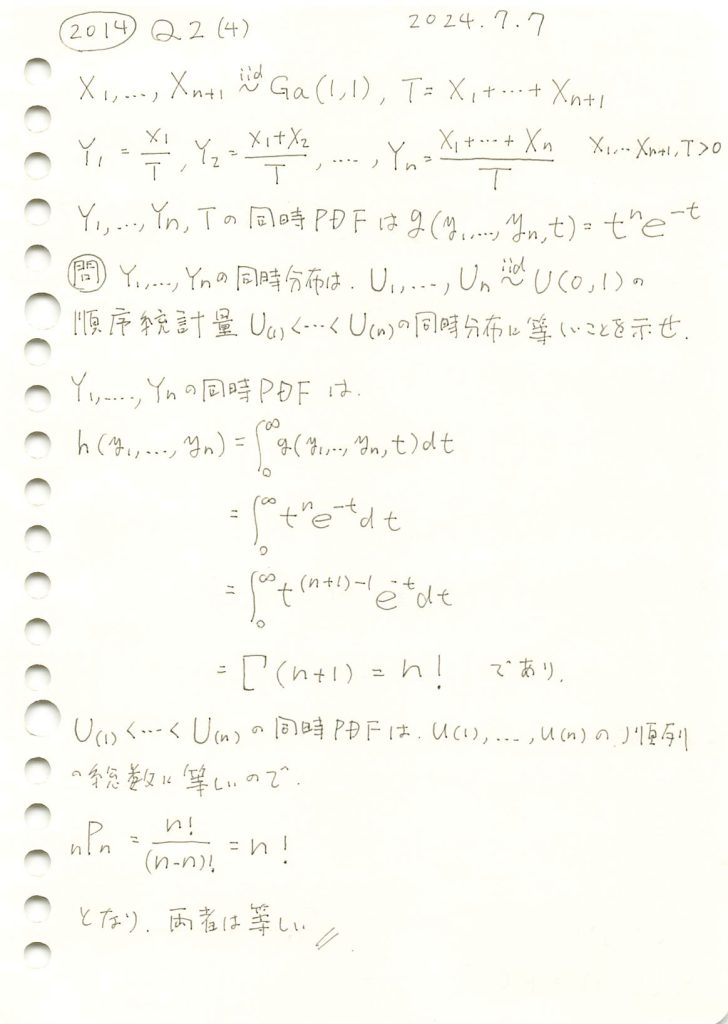
2014 Q2(4)
n個の一様分布の順序統計量の同時分布が、前問の分布に等しい事を示しました。
コード
![]() と
と![]() の個別の分布をシミュレーションし、グラフを描画してみます。
の個別の分布をシミュレーションし、グラフを描画してみます。
# 2014 Q2(4)  2025.1.3

import numpy as np
import matplotlib.pyplot as plt

# パラメータ設定
n = 5  # 次元数
num_samples = 10000  # サンプル数

# (1) ガンマ分布からサンプルを生成して X_1, ..., X_(n+1) を計算
X = np.random.gamma(shape=1, scale=1, size=(num_samples, n+1))  # ガンマ分布からサンプル生成
T = X.sum(axis=1)  # T = X_1 + X_2 + ... + X_(n+1)

# (2) Y_1, ..., Y_n を計算 (累積和を利用)
cumulative_sum_X = np.cumsum(X[:, :-1], axis=1)  # 累積和 (X_1, X_1 + X_2, ..., X_1 + ... + X_n)
Y = cumulative_sum_X / T[:, None]  # Y_i = (X_1 + ... + X_i) / T

# (3) 一様分布から順序統計量を生成
U = np.sort(np.random.uniform(0, 1, size=(num_samples, n)), axis=1)  # 順序統計量 U_(1), ..., U_(n)

# (4) 個別の分布を比較
plt.figure(figsize=(12, 6))

for i in range(n):
    plt.hist(Y[:, i], bins=50, alpha=0.5, density=True, label=rf"$Y_{i+1}$", histtype='step', linewidth=2)
    plt.hist(U[:, i], bins=50, alpha=0.5, density=True, label=rf"$U_{{({i+1})}}$", histtype='step', linestyle='--', linewidth=2)

# グラフの装飾
plt.title("累積比率と順序統計量の個別分布の比較", fontsize=16)
plt.xlabel("値", fontsize=14)
plt.ylabel("確率密度", fontsize=14)
plt.legend(fontsize=12)
plt.grid()
plt.show()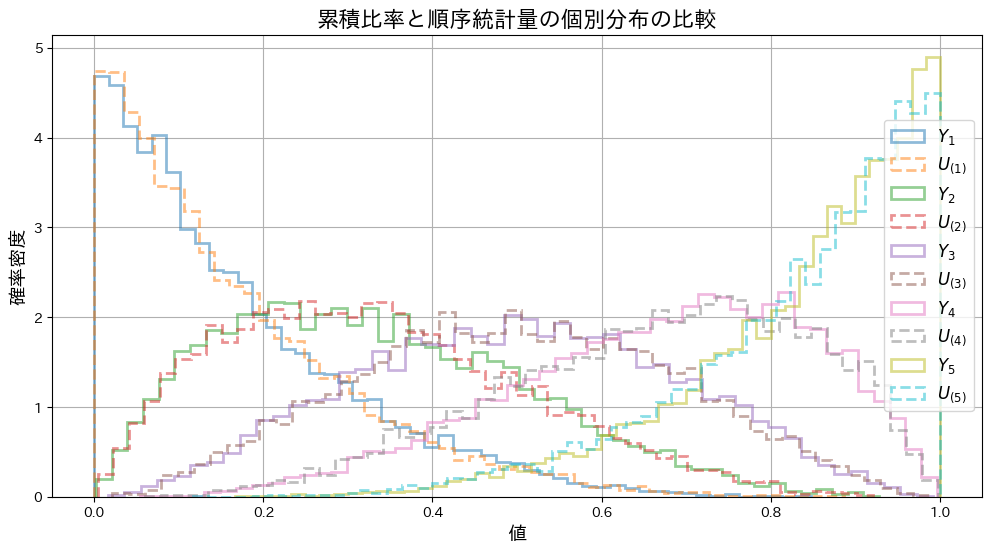
![]() と
と![]() の分布の形状は重なり、一致していることが確認できました。
の分布の形状は重なり、一致していることが確認できました。
次に、同時確率![]() と
と![]() の分布をシミュレーションし、グラフを描画してみます。
の分布をシミュレーションし、グラフを描画してみます。
# 2014 Q2(4)  2025.1.3

import numpy as np
import matplotlib.pyplot as plt

# パラメータ設定
n = 5  # 次元数
num_samples = 10000  # サンプル数

# (1) ガンマ分布からサンプルを生成して X_1, ..., X_(n+1) を計算
X = np.random.gamma(shape=1, scale=1, size=(num_samples, n+1))  # ガンマ分布からサンプル生成
T = X.sum(axis=1)  # T = X_1 + X_2 + ... + X_(n+1)

# (2) Y_1, ..., Y_n を計算 (累積和を利用)
cumulative_sum_X = np.cumsum(X[:, :-1], axis=1)  # 累積和 (X_1, X_1 + X_2, ..., X_1 + ... + X_n)
Y = cumulative_sum_X / T[:, None]  # Y_i = (X_1 + ... + X_i) / T

# (3) 一様分布から順序統計量を生成
U = np.sort(np.random.uniform(0, 1, size=(num_samples, n)), axis=1)  # 順序統計量 U_(1), ..., U_(n)

# (4) 同時確率密度を計算
cumulative_density = np.prod(Y, axis=1)  # 累積比率 (Y_1 * Y_2 * ... * Y_n)
order_stats_density = np.prod(U, axis=1)  # 順序統計量 (U_(1) * U_(2) * ... * U_(n))

# (5) ヒストグラムを描画して比較
plt.figure(figsize=(12, 6))

# 累積比率分布の同時確率密度
plt.hist(cumulative_density, bins=50, alpha=0.5, density=True, label=r"$f_Y(Y_1, Y_2, \ldots, Y_n)$")

# 順序統計量の同時確率密度
plt.hist(order_stats_density, bins=50, alpha=0.5, density=True, label=r"$f_U(U_{(1)}, U_{(2)}, \ldots, U_{(n)})$")

# グラフの装飾
plt.title("累積比率分布と順序統計量の同時確率密度の比較", fontsize=16)
plt.xlabel("同時確率密度", fontsize=14)
plt.ylabel("頻度", fontsize=14)
plt.legend(fontsize=12)
plt.grid()
plt.show()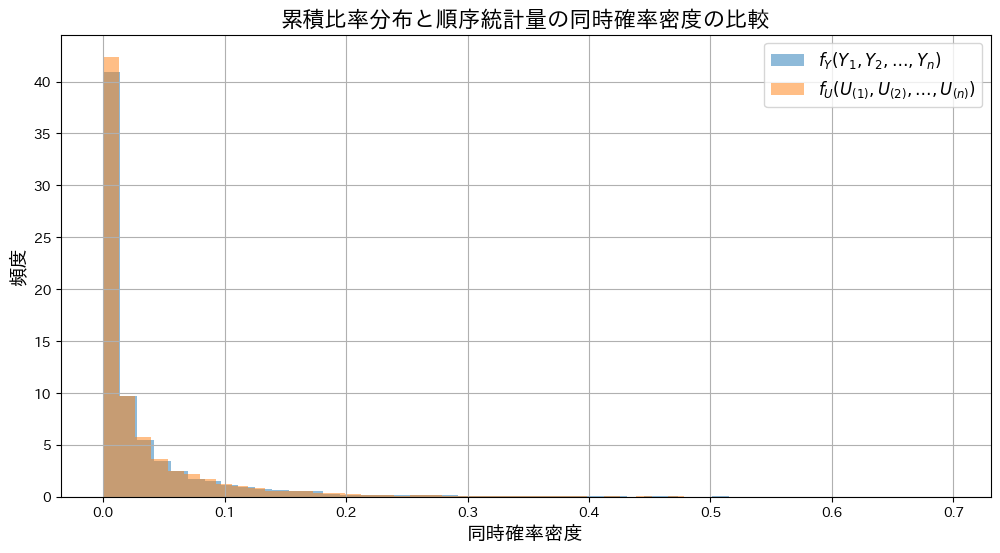
同時確率![]() と
と![]() の分布の形状は重なり、一致していることが確認できました。
の分布の形状は重なり、一致していることが確認できました。
2014 Q2(3)
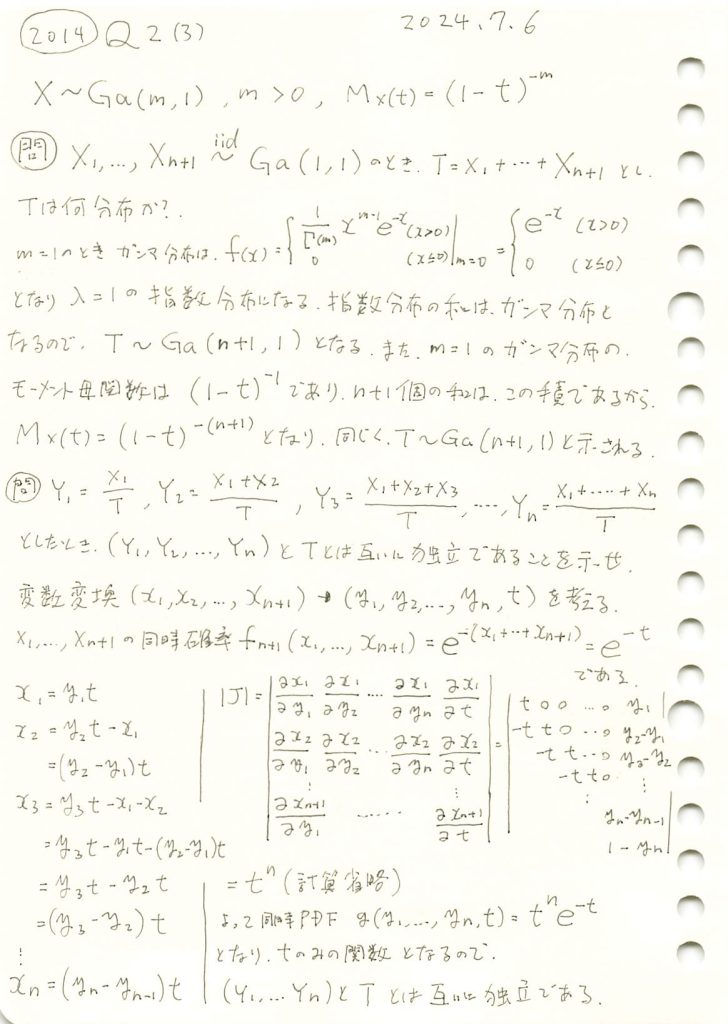
形状パラメータが1のガンマ分布は指数分布となり、その和はガンマ分布に従うことを示しました。
コード
TとYの分布についてシミュレーションを行い、それらの形状を視覚化して確認します。
# 2014 Q2(3)  2024.1.2

import numpy as np
import matplotlib.pyplot as plt
from scipy.stats import gamma

# パラメータ設定
n = 5  # n+1 個のガンマ分布の和
num_samples = 10000  # シミュレーション回数

# ガンマ分布から乱数を生成
X = gamma.rvs(a=1, scale=1, size=(num_samples, n+1))  # 各行に n+1 個のガンマ乱数を生成
T = X.sum(axis=1)  # T = X_1 + X_2 + ... + X_{n+1}

# 修正: Y を累積比率で計算
cumulative_sum_X = np.cumsum(X[:, :-1], axis=1)  # X_1, X_1 + X_2, ..., X_1 + ... + X_n
Y = cumulative_sum_X / T[:, None]  # Y_i = (X_1 + ... + X_i) / T

# T のヒストグラムを描画
plt.figure(figsize=(10, 6))
t_values = np.linspace(0, 30, 1000)
plt.hist(T, bins=50, density=True, alpha=0.6, color="blue", label="シミュレーション (T)")
plt.plot(t_values, gamma.pdf(t_values, a=n+1, scale=1), color="red", label=f"理論分布 (Gamma({n+1}, 1))")
plt.title("$T$ の分布", fontsize=16)
plt.xlabel("$T$", fontsize=14)
plt.ylabel("確率密度", fontsize=14)
plt.legend(fontsize=12)
plt.grid()
plt.show()

# Y の確認 (サンプルの分布)
plt.figure(figsize=(10, 6))
for i in range(n):
    plt.hist(Y[:, i], bins=50, density=True, alpha=0.5, label=f"$Y_{i+1}$")
plt.title("$Y$ の分布 (各比率)", fontsize=16)
plt.xlabel("$Y_i$", fontsize=14)
plt.ylabel("確率密度", fontsize=14)
plt.legend(fontsize=12)
plt.grid()
plt.show()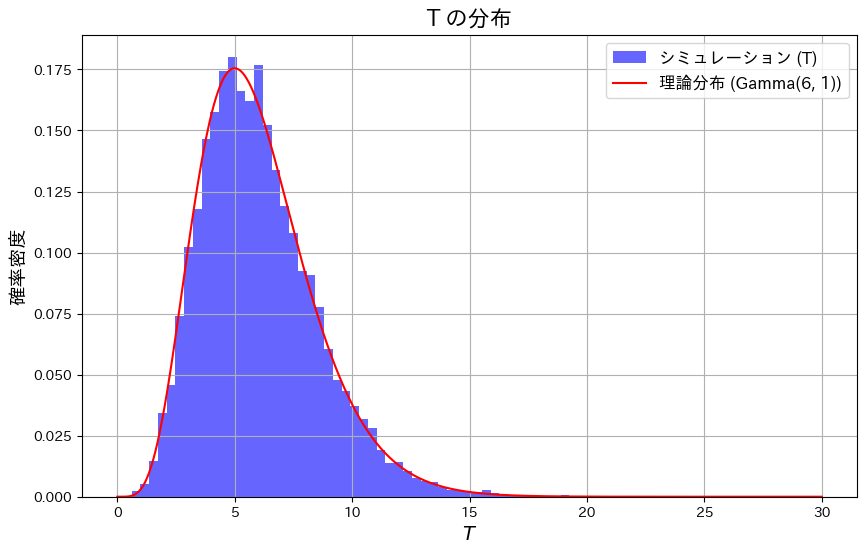
TがGa(n+1,1)のガンマ分布と一致することを確認しました。

各Yiは累積比率として定義されているため、順序性(Y1<Y2<..<Yn)を持つように見えます。
次に、YiとTが独立であることを確認するため、散布図を描画し、それぞれの共分散Cov(Yi, T)を算出します。
# 2014 Q2(3)  2024.1.2

import numpy as np
import matplotlib.pyplot as plt
from scipy.stats import gamma

# パラメータ設定
n = 5  # n+1 個のガンマ分布の和
num_samples = 10000  # シミュレーション回数

# ガンマ分布から乱数を生成
X = gamma.rvs(a=1, scale=1, size=(num_samples, n+1))  # 各行に n+1 個のガンマ乱数を生成
T = X.sum(axis=1)  # T = X_1 + X_2 + ... + X_{n+1}
Y = X[:, :-1] / T[:, None]  # Y_i = X_i / T (最後の列を除いて正規化)

# (1) 共分散の計算
print("各 Y_i と T の共分散:")
for i in range(n):
    cov = np.cov(Y[:, i], T)[0, 1]  # 共分散行列から共分散を取得
    print(f"Cov(Y_{i+1}, T) = {cov:.5f}")

# (2) 散布図の描画
plt.figure(figsize=(12, 8))
for i in range(n):
    plt.scatter(T, Y[:, i], alpha=0.3, label=f"$Y_{i+1}$ vs $T$")

plt.title("散布図: 各 $Y_i$ と $T$ の関係", fontsize=16)
plt.xlabel("$T$", fontsize=14)
plt.ylabel("$Y_i$", fontsize=14)
plt.legend(fontsize=12)
plt.grid()
plt.show()
各 Y_i と T の共分散:
Cov(Y_1, T) = 0.00426
Cov(Y_2, T) = 0.00394
Cov(Y_3, T) = -0.00261
Cov(Y_4, T) = -0.00364
Cov(Y_5, T) = -0.00399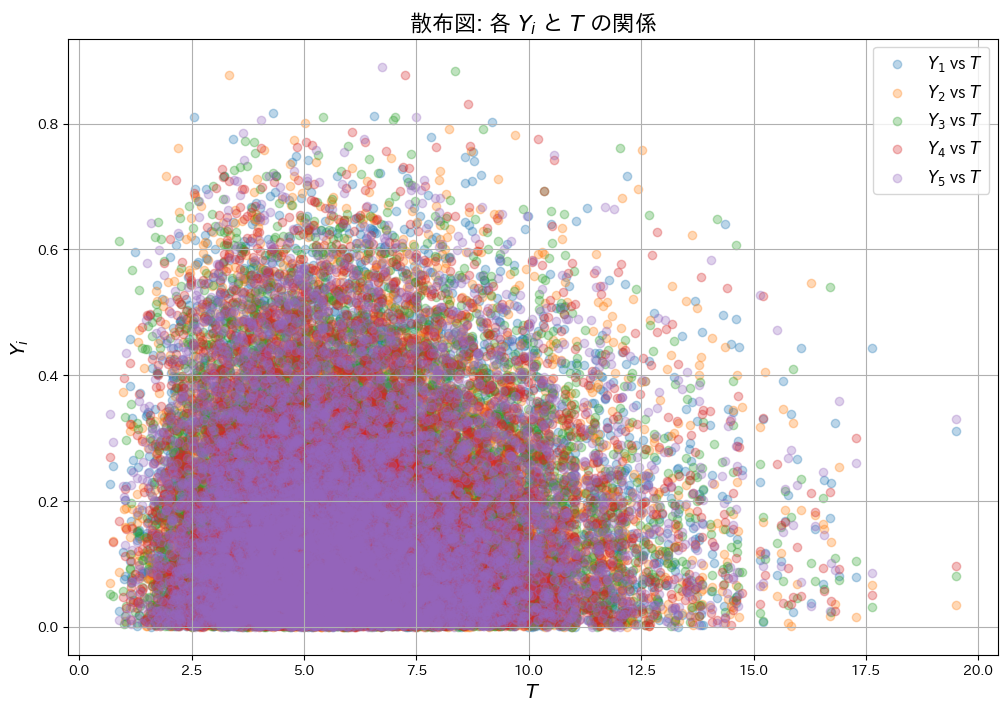
それぞれの共分散Cov(Yi, T)はほぼ0を示し、散布図からもYiとTが互いに影響を与えていないことが確認できました。
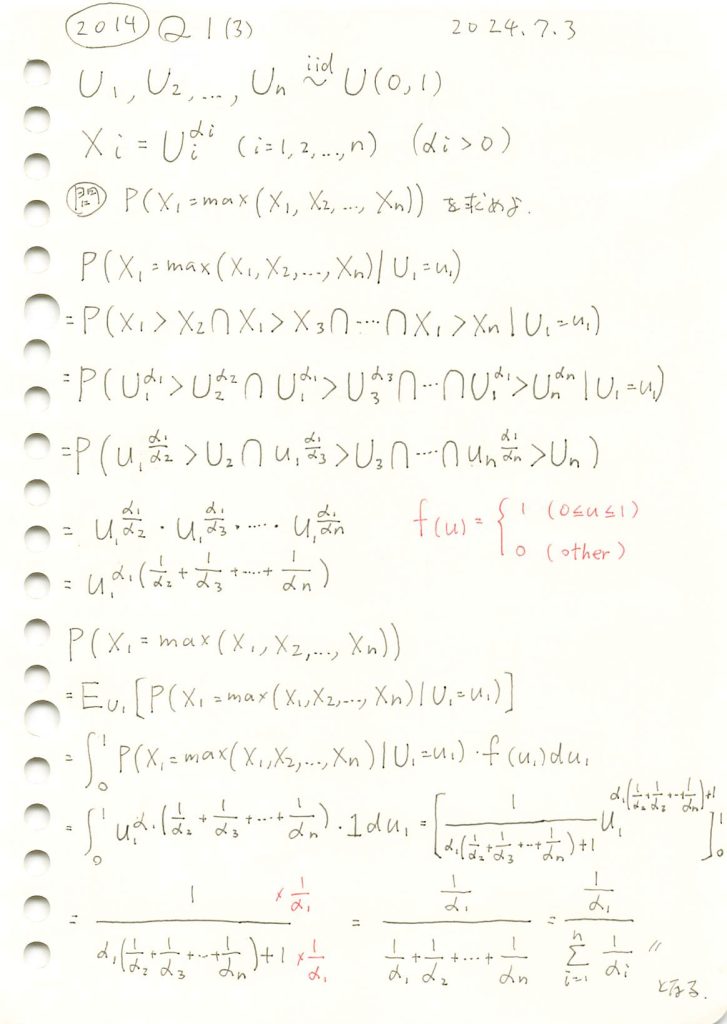
2014 Q1(3)
一様分布の指数を取るn個の確率変数のうち特定の一つが最大値をとる確率を求めました。
コード
与式は![]() と考え、
と考え、![]() とした場合の
とした場合の![]() をシミュレーションで計算し、理論値と比較します。
をシミュレーションで計算し、理論値と比較します。
# 2014 Q1(3)  2024.12.30

import numpy as np
import matplotlib.pyplot as plt

# シミュレーションの設定
n_simulations = 10**6

# 確率変数の数とパラメータの設定
n = 5
alphas = [2, 3, 4, 5, 6]  # α1, α2, ..., αn

# 一様分布からサンプリング
U = np.random.uniform(0, 1, (n_simulations, n))
X = U**np.array(alphas)

# 確率変数 Z を計算 (Z = X1 - max(X2, ..., Xn))
Z_diff = X[:, 0] - np.max(X[:, 1:], axis=1)

# Z の累積分布関数 (CDF) を計算
z_sorted = np.sort(Z_diff)
cdf_Z = np.arange(1, len(z_sorted) + 1) / len(z_sorted)

# Z = 0 の累積確率を計算
cumulative_prob_at_zero = cdf_Z[np.searchsorted(z_sorted, 0)]

# 理論値の計算
theoretical_prob = (1 / alphas[0]) / sum(1 / alpha for alpha in alphas)

# 結果を出力
print(f"Z = 0 における続繁確率: {cumulative_prob_at_zero:.3f}")
print(f"シミュレーション結果: P(X1 > max(X2, ..., Xn)) = {1 - cumulative_prob_at_zero:.6f}")
print(f"理論値: P(X1 > max(X2, ..., Xn)) = {theoretical_prob:.6f}")
print(f"誤差: {abs((1 - cumulative_prob_at_zero) - theoretical_prob):.6f}")

# PDF および CDF のプロット (PDF にも Z = 0 の赤い線を追加)
plt.figure(figsize=(14, 6))

# PDF
plt.subplot(1, 2, 1)
plt.hist(Z_diff, bins=100, density=True, alpha=0.7, label=r'$Z = X_1 - \max(X_2, ..., X_n)$', color='blue')
plt.axvline(x=0, color='red', linestyle='--', label=r'$Z = 0$ (境界)')  # Z = 0 の赤い線を追加
plt.title('Z = X1 - max(X2, ..., Xn) の確率密度関数 (PDF)', fontsize=14)
plt.xlabel('Z', fontsize=12)
plt.ylabel('密度', fontsize=12)
plt.legend()

# CDF
plt.subplot(1, 2, 2)
plt.plot(z_sorted, cdf_Z, label=r'$Z = X_1 - \max(X_2, ..., X_n)$', color='blue')
plt.axvline(x=0, color='red', linestyle='--', label=r'$Z = 0$ (境界)')  # Z = 0 の赤い線
plt.text(0.05, cumulative_prob_at_zero, f'{cumulative_prob_at_zero:.3f}', color='red', fontsize=12)
plt.title('Z = X1 - max(X2, ..., Xn) の続繁分布関数 (CDF)', fontsize=14)
plt.xlabel('Z', fontsize=12)
plt.ylabel('続繁確率', fontsize=12)
plt.legend()

plt.tight_layout()
plt.show()
Z = 0 における続繁確率: 0.655
シミュレーション結果: P(X1 > max(X2, ..., Xn)) = 0.345030
理論値: P(X1 > max(X2, ..., Xn)) = 0.344828
誤差: 0.000202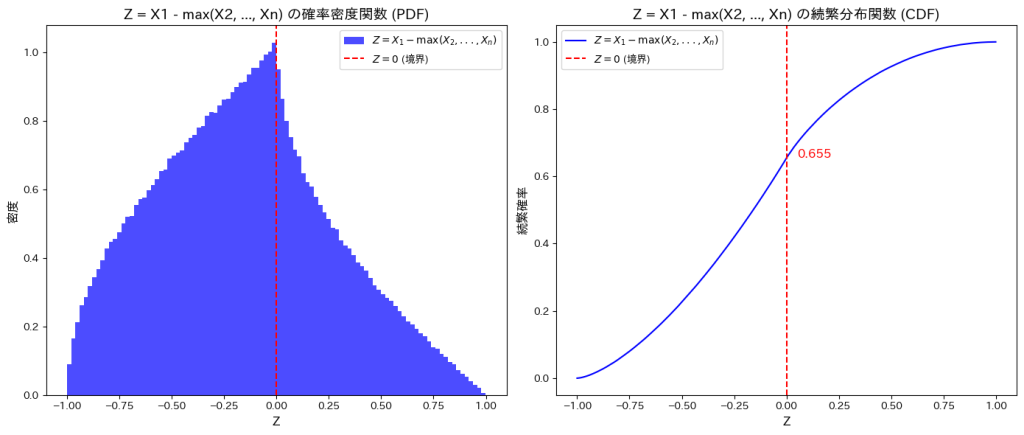
![]() はシミュレーションの結果、理論値と一致しました。
はシミュレーションの結果、理論値と一致しました。
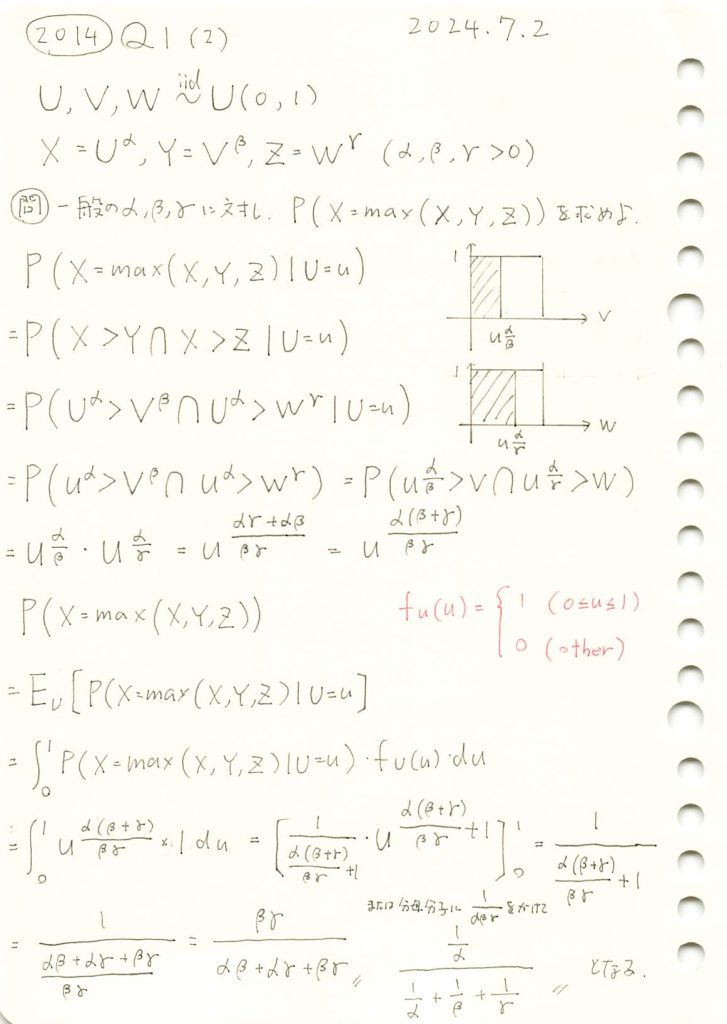
2014 Q1(2)
一様分布の指数を取る三つの確率変数のうち特定の一つが最大値をとる確率を求めました。
コード
与式は![]() と考え、
と考え、![]() とした場合の
とした場合の![]() をシミュレーションで計算し、理論値と比較します。
をシミュレーションで計算し、理論値と比較します。
# 2014 Q1(2)  2024.12.29

import numpy as np
import matplotlib.pyplot as plt

# シミュレーションの設定
n_simulations = 10**6

# 一様分布からサンプリング
U = np.random.uniform(0, 1, n_simulations)
V = np.random.uniform(0, 1, n_simulations)
W = np.random.uniform(0, 1, n_simulations)

# パラメータの設定
alpha, beta, gamma = 2, 3, 4

# X, Y, Z の計算
X = U**alpha
Y = V**beta
Z = W**gamma

# 確率変数 Z を計算 (例: Z = X - max(Y, Z))
Z_diff = X - np.maximum(Y, Z)

# Z の累積分布関数 (CDF) を計算
z_sorted = np.sort(Z_diff)
cdf_Z = np.arange(1, len(z_sorted) + 1) / len(z_sorted)

# Z = 0 の累積確率を計算
cumulative_prob_at_zero = cdf_Z[np.searchsorted(z_sorted, 0)]

# 理論値の計算
theoretical_prob = (1 / alpha) / (1 / alpha + 1 / beta + 1 / gamma)

# 結果を出力
print(f"Z = 0 における累積確率: {cumulative_prob_at_zero:.3f}")
print(f"シミュレーション結果: P(X > max(Y, Z)) = {1 - cumulative_prob_at_zero:.6f}")
print(f"理論値: P(X > max(Y, Z)) = {theoretical_prob:.6f}")
print(f"誤差: {abs((1 - cumulative_prob_at_zero) - theoretical_prob):.6f}")

# PDF および CDF のプロット (PDF にも Z = 0 の赤い線を追加)
plt.figure(figsize=(14, 6))

# PDF
plt.subplot(1, 2, 1)
plt.hist(Z_diff, bins=100, density=True, alpha=0.7, label=r'$Z = X - \max(Y, Z)$', color='blue')
plt.axvline(x=0, color='red', linestyle='--', label=r'$Z = 0$ (境界)')  # Z = 0 の赤い線を追加
plt.title('Z = X - max(Y, Z) の確率密度関数 (PDF)', fontsize=14)
plt.xlabel('Z', fontsize=12)
plt.ylabel('密度', fontsize=12)
plt.legend()

# CDF
plt.subplot(1, 2, 2)
plt.plot(z_sorted, cdf_Z, label=r'$Z = X - \max(Y, Z)$', color='blue')
plt.axvline(x=0, color='red', linestyle='--', label=r'$Z = 0$ (境界)')  # Z = 0 の赤い線
plt.text(0.05, cumulative_prob_at_zero, f'{cumulative_prob_at_zero:.3f}', color='red', fontsize=12)
plt.title('Z = X - max(Y, Z) の累積分布関数 (CDF)', fontsize=14)
plt.xlabel('Z', fontsize=12)
plt.ylabel('累積確率', fontsize=12)
plt.legend()

plt.tight_layout()
plt.show()
Z = 0 における累積確率: 0.538
シミュレーション結果: P(X > max(Y, Z)) = 0.462111
理論値: P(X > max(Y, Z)) = 0.461538
誤差: 0.000573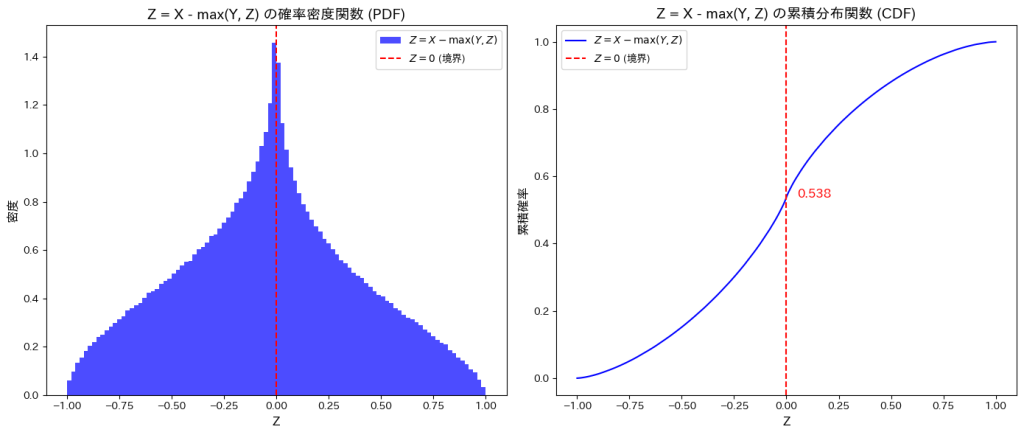
![]() はシミュレーションの結果、理論値と一致しました。
はシミュレーションの結果、理論値と一致しました。
2014 Q1(1)
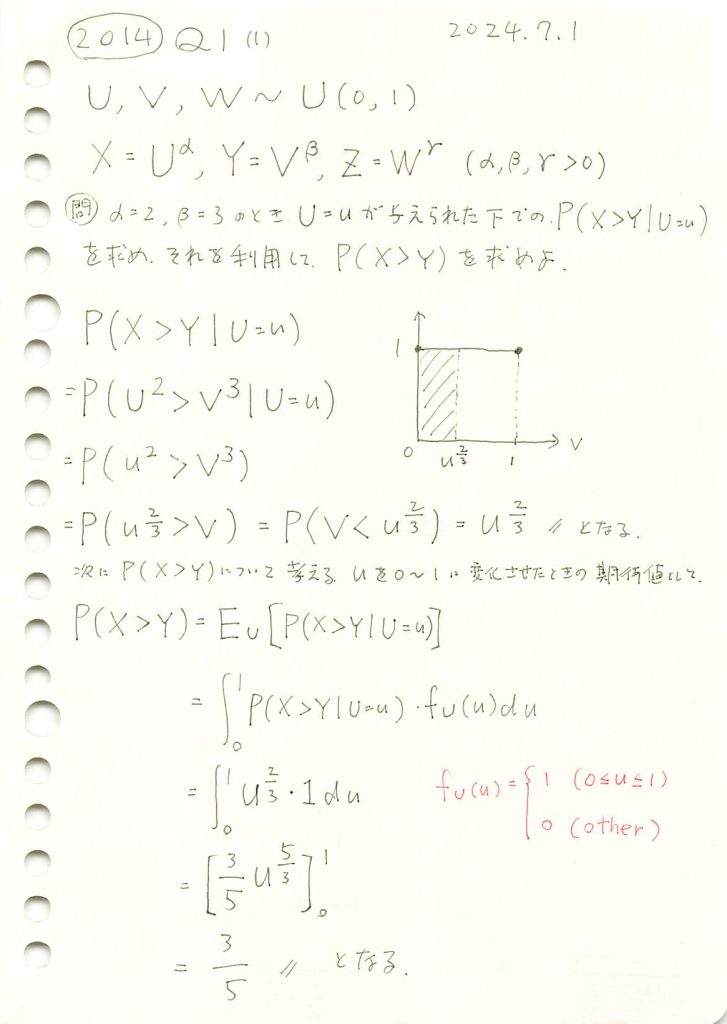
一様分布の指数を取る二つの確率変数の大小が決まっている場合の確率を条件付確率の期待値を取ることで求めました。
コード
XとYの頻度分布を3Dプロットで可視化してみます。
# 2014 Q1(1)  2024.12.28

import numpy as np
import matplotlib.pyplot as plt
from mpl_toolkits.mplot3d import Axes3D

# シミュレーションの設定
n_simulations = 10**5  # サンプルサイズ

# 一様分布からサンプリング
U = np.random.uniform(0, 1, n_simulations)
V = np.random.uniform(0, 1, n_simulations)

# X, Y の計算
X = U**2
Y = V**3

# 3Dプロット
fig = plt.figure(figsize=(10, 8))
ax = fig.add_subplot(111, projection='3d')

# 2次元ヒストグラムを計算
hist, xedges, yedges = np.histogram2d(X, Y, bins=50, density=True)

# 座標軸を作成
xpos, ypos = np.meshgrid(xedges[:-1], yedges[:-1], indexing="ij")
xpos = xpos.ravel()
ypos = ypos.ravel()
zpos = np.zeros_like(xpos)

# 棒の高さ
dx = dy = 0.02
dz = hist.ravel()

# 色分け: X > Y (緑), X = Y (黄色), X < Y (青)
tolerance = 0.01  # 許容範囲を指定して X = Y の近似を表現
colors = np.where(
    np.abs(xpos - ypos) < tolerance, 'yellow',
    np.where(xpos > ypos, 'green', 'blue')
)

# 3Dバーを描画
ax.bar3d(xpos, ypos, zpos, dx, dy, dz, zsort='average', alpha=0.7, color=colors)

# ラベルとタイトル
ax.set_xlabel('X')
ax.set_ylabel('Y')
ax.set_zlabel('頻度', labelpad=-10)  # ラベルの位置を調整
#ax.set_title(r'$X > Y$ (緑), $X = Y$ (黄色), $X < Y$ (青)', fontsize=14)
#ax.set_title(r'$X$ と $Y$ の出現頻度', fontsize=14)
ax.set_title(r'$X$ と $Y$ の出現頻度(組)', fontsize=14)

# 凡例
legend_handles = [
    plt.Line2D([0], [0], color='green', lw=4, label=r'$X > Y$ (緑)'),
    plt.Line2D([0], [0], color='yellow', lw=4, label=r'$X = Y$ (黄色)'),
    plt.Line2D([0], [0], color='blue', lw=4, label=r'$X < Y$ (青)')
]
ax.legend(handles=legend_handles, loc='upper left', bbox_to_anchor=(1.05, 1), fontsize=10)

# カメラビュー
ax.view_init(elev=30, azim=45)

plt.tight_layout()
plt.show()
X>Yの領域は、X<Yの領域と比べて出現頻度が高いようです。
次に、XとYの大小関係を確認するために確率変数Z=X-Yを同に導入し、その確率密度と累積分布をシミュレーションにより求め、P(X>Y)を計算してみます。
# 2014 Q1(1)  2024.12.28

import numpy as np
import matplotlib.pyplot as plt

# シミュレーションの設定
np.random.seed(42)
n_simulations = 10**6

# 一様分布からサンプリング
U = np.random.uniform(0, 1, n_simulations)
V = np.random.uniform(0, 1, n_simulations)

# X, Y の計算
X = U**2
Y = V**3

# Z = X - Y を計算
Z = X - Y

# Z の累積分布関数 (CDF) を計算
z_sorted = np.sort(Z)
cdf_Z = np.arange(1, len(z_sorted) + 1) / len(z_sorted)

# Z = 0 の累積確率を計算
cumulative_prob_at_zero = cdf_Z[np.searchsorted(z_sorted, 0)]

# 結果を出力
print(f"Z = 0 における累積確率: {cumulative_prob_at_zero:.3f}")
print(f"P(X > Y) = {1 - cumulative_prob_at_zero:.3f}")

# PDF および CDF のプロット (PDF にも Z = 0 の赤い線を追加)
plt.figure(figsize=(14, 6))

# PDF
plt.subplot(1, 2, 1)
plt.hist(Z, bins=100, density=True, alpha=0.7, label=r'$Z = X - Y$', color='blue')
plt.axvline(x=0, color='red', linestyle='--', label=r'$Z = 0$ (境界)')  # Z = 0 の赤い線を追加
plt.title('Z = X - Y の確率密度関数 (PDF)', fontsize=14)
plt.xlabel('Z', fontsize=12)
plt.ylabel('密度', fontsize=12)
plt.legend()

# CDF
plt.subplot(1, 2, 2)
plt.plot(z_sorted, cdf_Z, label=r'$Z = X - Y$', color='blue')
plt.axvline(x=0, color='red', linestyle='--', label=r'$Z = 0$ (境界)')  # Z = 0 の赤い線
plt.text(0.05, cumulative_prob_at_zero, f'{cumulative_prob_at_zero:.3f}', color='red', fontsize=12)
plt.title('Z = X - Y の累積分布関数 (CDF)', fontsize=14)
plt.xlabel('Z', fontsize=12)
plt.ylabel('累積確率', fontsize=12)
plt.legend()

plt.tight_layout()
plt.show()
Z = 0 における累積確率: 0.399
P(X > Y) = 0.601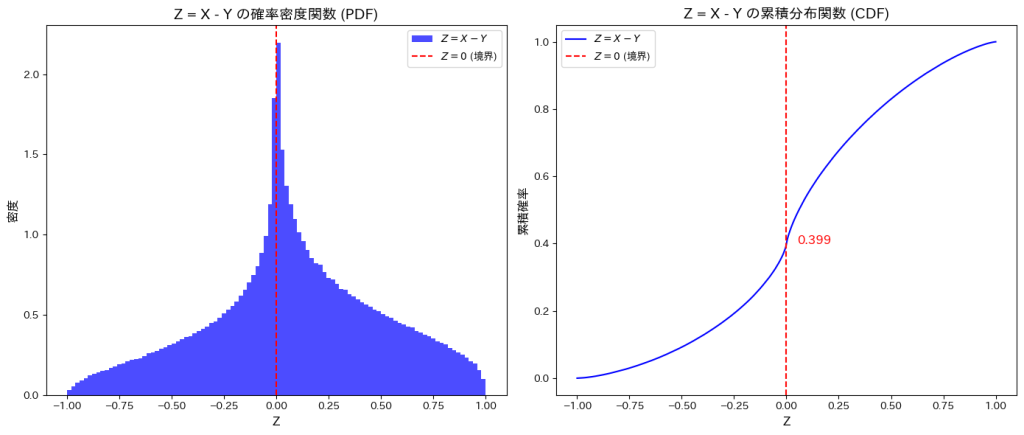
シミュレーションにより求めたP(X>Y)は、理論値と一致することが確認できました。
2015 Q5(6)
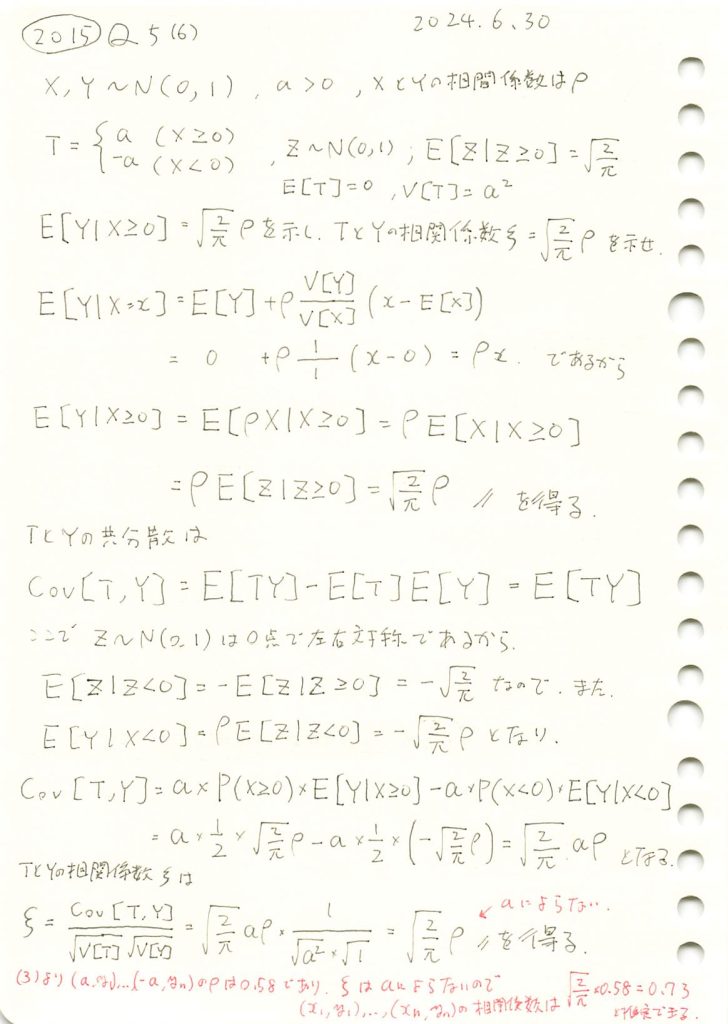
二変量正規分布の条件付期待値を求め、二値化された条件付確率変数との相関係数を求めました。
コード
条件付期待値![]() と相関係数
と相関係数 ![]() が、理論値
が、理論値![]() に一致することをシミュレーションで確認します。
に一致することをシミュレーションで確認します。
# 2015 Q5(6)  2024.12.27

import numpy as np
import matplotlib.pyplot as plt

# パラメータ設定
rho = 0.8  # 相関係数
num_samples = 100000  # サンプル数

# 2次元正規分布の生成
mean = [0, 0]  # 平均
cov = [[1, rho], [rho, 1]]  # 共分散行列
X, Y = np.random.multivariate_normal(mean, cov, num_samples).T

# 条件 X >= 0 の Y の期待値 (シミュレーション)
Y_given_X_positive = Y[X >= 0]
simulated_mean = np.mean(Y_given_X_positive)

# 理論値の計算
theoretical_mean = np.sqrt(2 / np.pi) * rho

# T の定義 (a = 1 と仮定)
a = 1
T = np.where(X >= 0, a, -a)

# 相関係数の計算 (T と Y)
simulated_corr = np.corrcoef(T, Y)[0, 1]
theoretical_corr = np.sqrt(2 / np.pi) * rho

# 結果の表示
print("シミュレーション結果:")
print(f"E[Y | X >= 0] (シミュレーション): {simulated_mean:.4f}")
print(f"E[Y | X >= 0] (理論値): {theoretical_mean:.4f}")
print(f"相関係数 Corr(T, Y) (シミュレーション): {simulated_corr:.4f}")
print(f"相関係数 Corr(T, Y) (理論値): {theoretical_corr:.4f}")

# ヒストグラムの描画
plt.figure(figsize=(10, 6))
plt.hist(Y_given_X_positive, bins=50, density=True, color='lightblue', edgecolor='black', alpha=0.7, label="Y | X >= 0 の分布")
plt.axvline(simulated_mean, color="green", linestyle="--", label=f"シミュレーション期待値: {simulated_mean:.4f}")
plt.axvline(theoretical_mean, color="red", linestyle="--", label=f"理論期待値: {theoretical_mean:.4f}")

# グラフの設定
plt.title("条件付き期待値 E[Y | X >= 0] の確認", fontsize=14)
plt.xlabel("Y の値", fontsize=12)
plt.ylabel("確率密度", fontsize=12)
plt.legend(fontsize=10)
plt.grid(True)
plt.tight_layout()
plt.show()
シミュレーション結果:
E[Y | X >= 0] (シミュレーション): 0.6386
E[Y | X >= 0] (理論値): 0.6383
相関係数 Corr(T, Y) (シミュレーション): 0.6384
相関係数 Corr(T, Y) (理論値): 0.6383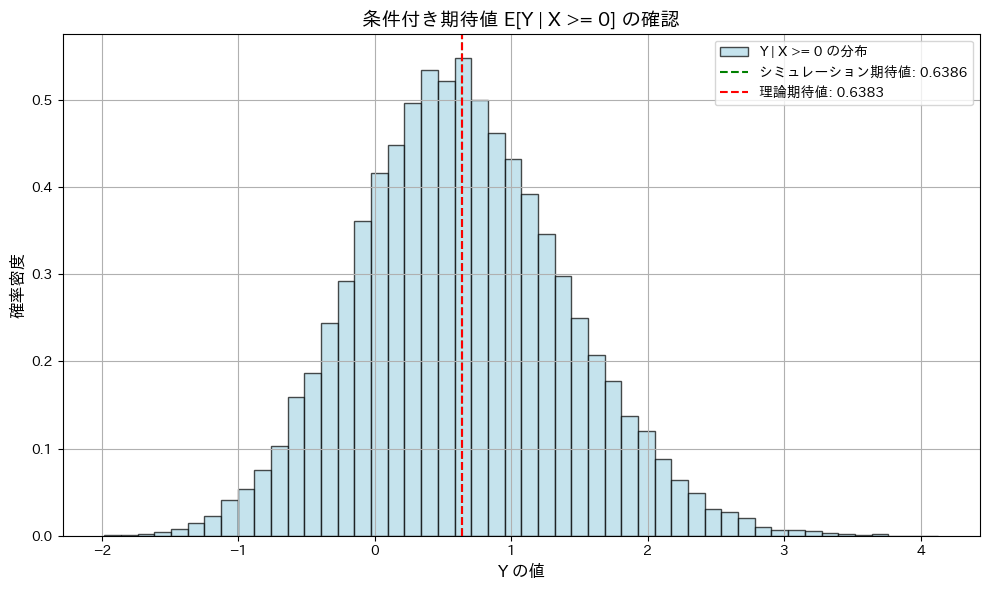
条件付期待値![]() と相関係数
と相関係数 ![]() が、共に理論値
が、共に理論値![]() に一致することが確認されました。
に一致することが確認されました。
次に、相関係数 ![]() がaの値に依らず一定であることを確認します。また、いくつかの相関係数
がaの値に依らず一定であることを確認します。また、いくつかの相関係数![]() を変化させて確認します。
を変化させて確認します。
# 2015 Q5(6)  2024.12.27

import numpy as np
import matplotlib.pyplot as plt

# パラメータ設定
rho_values = [0.2, 0.5, 0.8]  # いくつかの相関係数 ρ
a_values = np.linspace(0.1, 5, 50)  # a の範囲
num_samples = 100000  # サンプル数

# 結果を格納する辞書
results = {rho: [] for rho in rho_values}

# シミュレーション
for rho in rho_values:
    mean = [0, 0]  # 平均
    cov = [[1, rho], [rho, 1]]  # 共分散行列

    for a in a_values:
        # 2次元正規分布の生成
        X, Y = np.random.multivariate_normal(mean, cov, num_samples).T

        # T の定義
        T = np.where(X >= 0, a, -a)

        # 相関係数の計算
        simulated_corr = np.corrcoef(T, Y)[0, 1]
        results[rho].append(simulated_corr)

# グラフの描画
plt.figure(figsize=(10, 6))
for rho, corr_values in results.items():
    plt.plot(a_values, corr_values, label=f"ρ = {rho}")

# 理論値の計算
theoretical_corr = np.sqrt(2 / np.pi) * np.array(rho_values)

# グラフの設定
plt.title("T と Y の相関係数 (Corr(T, Y)) vs a", fontsize=14)
plt.xlabel("a の値", fontsize=12)
plt.ylabel("相関係数 Corr(T, Y)", fontsize=12)
plt.axhline(y=0, color="black", linestyle="--", linewidth=0.8)  # 基準線
plt.legend(fontsize=10)
plt.grid(True)
plt.tight_layout()
plt.show()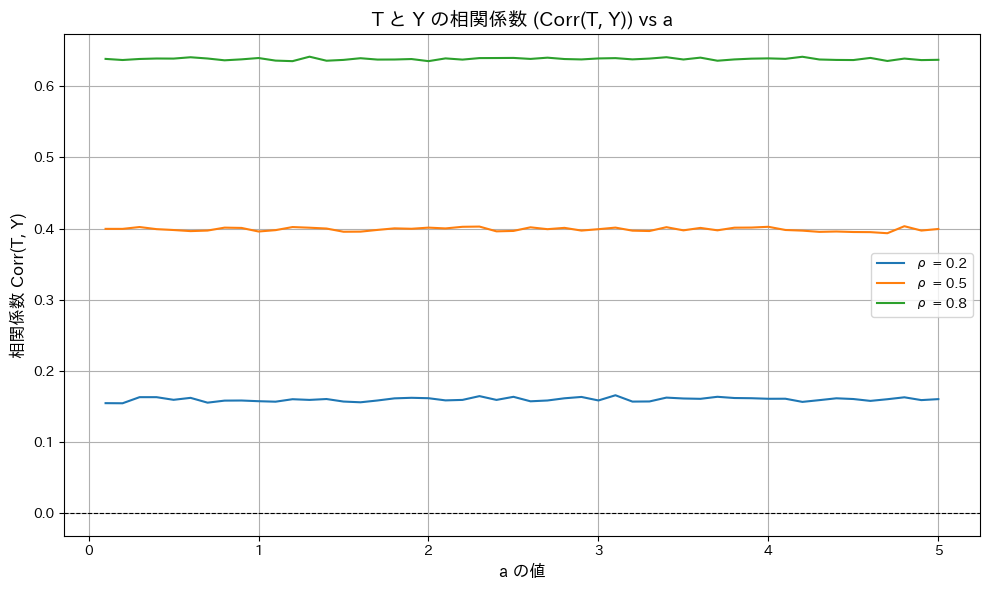
相関係数 ![]() がaの値に依らず一定であることが確認されました。
がaの値に依らず一定であることが確認されました。
2015 Q5(5)
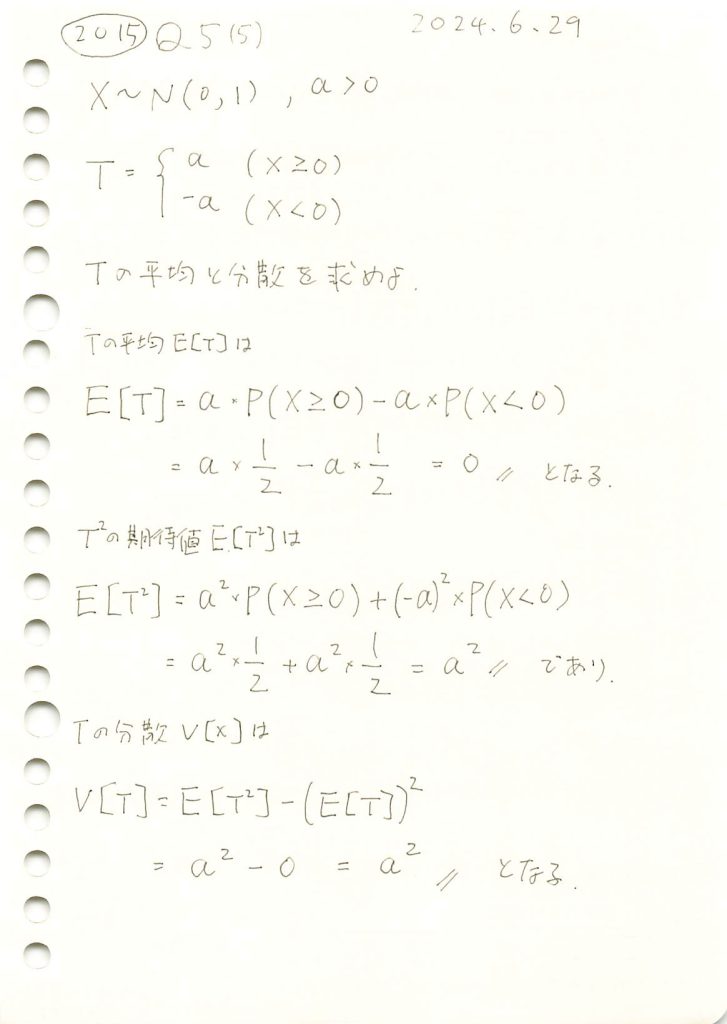
標準正規分布に従う確率変数を条件に二値化する確率変数の平均と分散を求めました。
コード
Tの平均と分散をシミュレーションで計算し、それらが理論値と一致するか確認をします。
# 2015 Q5(5)  2024.12.26

import numpy as np

# パラメータ
a = 2  # a の値
num_samples = 100000  # サンプル数

# 正規分布から X を生成
X = np.random.normal(0, 1, num_samples)

# T を定義
T = np.where(X >= 0, a, -a)

# 平均と分散を計算
T_mean = np.mean(T)
T_variance = np.var(T)

# 結果を出力
print("シミュレーション結果:")
print("T の平均 (E[T]):", T_mean)
print("T の分散 (Var(T)):", T_variance)

# 理論値
print("\n理論値:")
print("T の平均 (E[T]):", 0)
print("T の分散 (Var(T)):", a**2)
シミュレーション結果:
T の平均 (E[T]): 0.00388
T の分散 (Var(T)): 3.999984945600001
理論値:
T の平均 (E[T]): 0
T の分散 (Var(T)): 4シミュレーションで計算したTの平均と分散は理論値と一致しました。
2015 Q5(4)
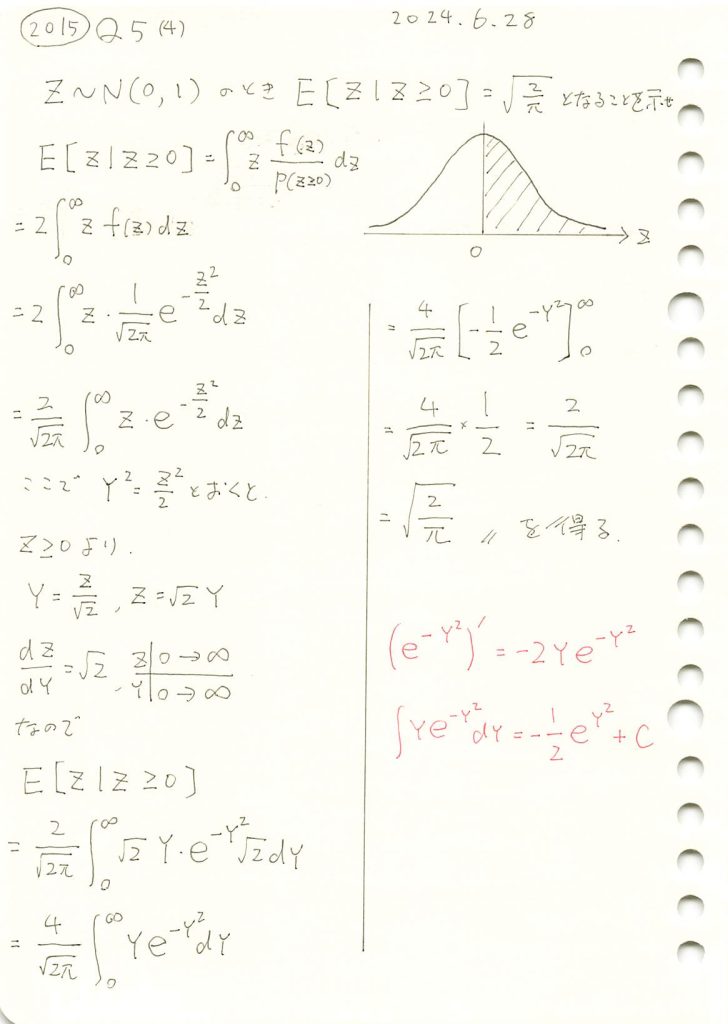
標準正規分布に従う確率変数の、右半分の条件付期待値を求めました。
コード
標準正規分布に従う確率変数 Zについて、条件付き期待値![]() になることをシミュレーションで確認をします。
になることをシミュレーションで確認をします。
# 2015 Q5(4)  2024.12.25

import numpy as np
import matplotlib.pyplot as plt
from scipy.stats import norm

# シミュレーションパラメータ
num_samples = 100000  # サンプル数

# 標準正規分布からサンプルを生成
samples = np.random.normal(0, 1, num_samples)

# 条件 Z >= 0 のサンプルを抽出
samples_positive = samples[samples >= 0]

# 条件付き期待値のシミュレーション値
simulated_mean = np.mean(samples_positive)

# 理論値
theoretical_mean = np.sqrt(2 / np.pi)

# ヒストグラムの準備
x = np.linspace(-3, 3, 500)  # x軸の範囲
pdf = norm.pdf(x)  # 標準正規分布のPDF

# グラフの描画
plt.figure(figsize=(10, 6))

# 正規分布のPDF
plt.plot(x, pdf, label="標準正規分布のPDF", color="blue", linewidth=2)

# 条件 Z >= 0 のサンプルのヒストグラム
plt.hist(samples_positive, bins=50, density=True, alpha=0.6, color="orange", label="条件 Z ≧ 0 のシミュレーション")

# 結果の表示
plt.axvline(simulated_mean, color="green", linestyle="--", label=f"シミュレーション期待値: {simulated_mean:.4f}")
plt.axvline(theoretical_mean, color="red", linestyle="--", label=f"理論期待値: {theoretical_mean:.4f}")

# グラフの設定
plt.title("条件付き期待値の確認 (Z ≧ 0)", fontsize=14)
plt.xlabel("Z の値", fontsize=12)
plt.ylabel("確率密度", fontsize=12)
plt.legend(fontsize=10)
plt.grid(True)

# グラフを表示
plt.tight_layout()
plt.show()
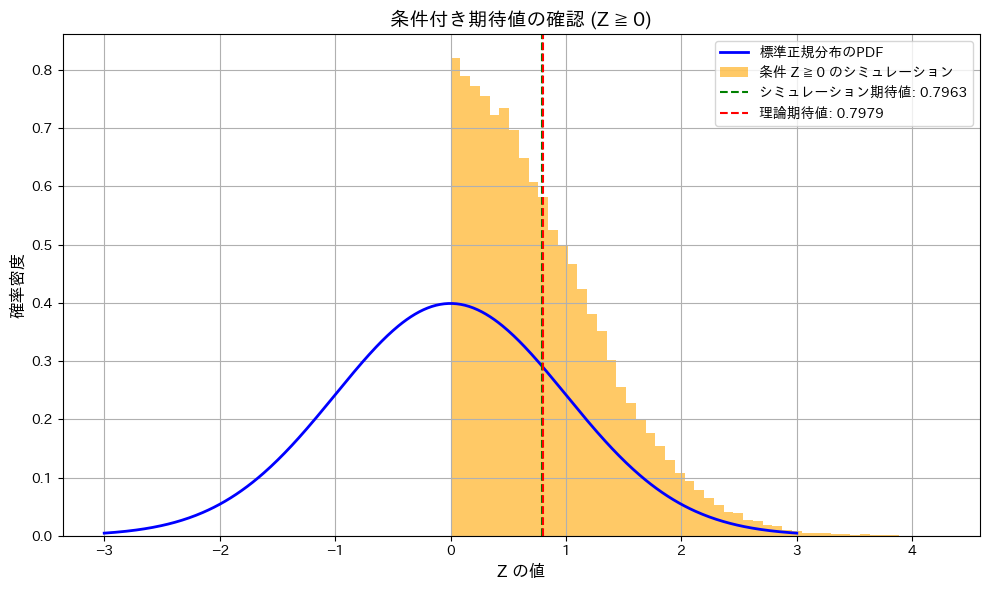
条件付き期待値![]() であることが確認されました。
であることが確認されました。
