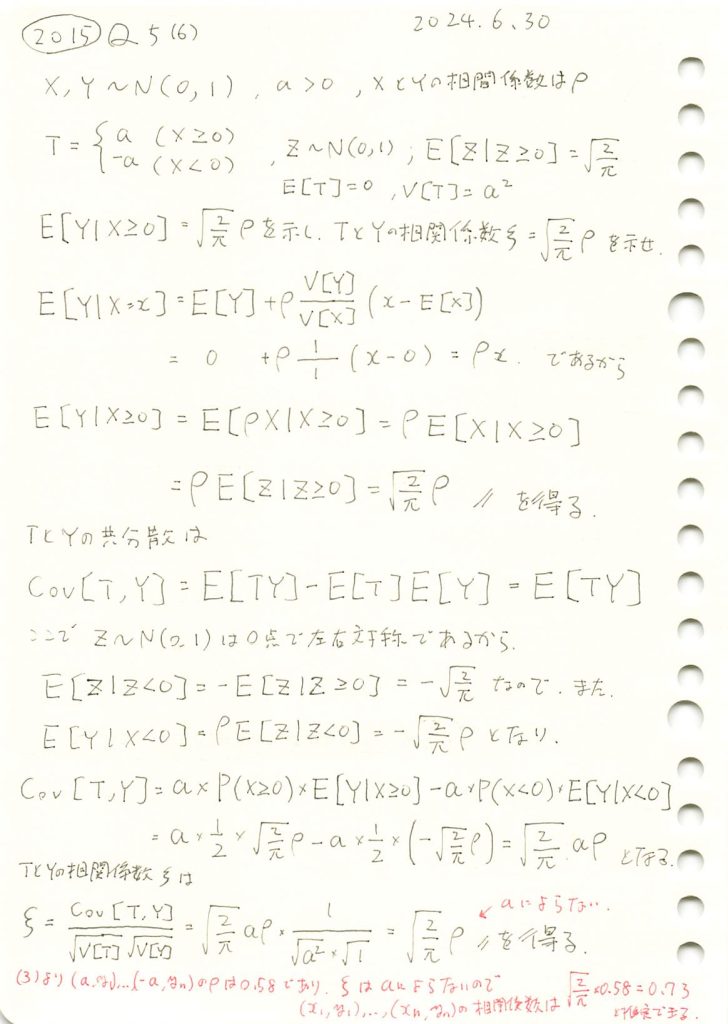
二変量正規分布の条件付期待値を求め、二値化された条件付確率変数との相関係数を求めました。

コード
条件付期待値![]() と相関係数
と相関係数 ![]() が、理論値
が、理論値![]() に一致することをシミュレーションで確認します。
に一致することをシミュレーションで確認します。
# 2015 Q5(6)  2024.12.27

import numpy as np
import matplotlib.pyplot as plt

# パラメータ設定
rho = 0.8  # 相関係数
num_samples = 100000  # サンプル数

# 2次元正規分布の生成
mean = [0, 0]  # 平均
cov = [[1, rho], [rho, 1]]  # 共分散行列
X, Y = np.random.multivariate_normal(mean, cov, num_samples).T

# 条件 X >= 0 の Y の期待値 (シミュレーション)
Y_given_X_positive = Y[X >= 0]
simulated_mean = np.mean(Y_given_X_positive)

# 理論値の計算
theoretical_mean = np.sqrt(2 / np.pi) * rho

# T の定義 (a = 1 と仮定)
a = 1
T = np.where(X >= 0, a, -a)

# 相関係数の計算 (T と Y)
simulated_corr = np.corrcoef(T, Y)[0, 1]
theoretical_corr = np.sqrt(2 / np.pi) * rho

# 結果の表示
print("シミュレーション結果:")
print(f"E[Y | X >= 0] (シミュレーション): {simulated_mean:.4f}")
print(f"E[Y | X >= 0] (理論値): {theoretical_mean:.4f}")
print(f"相関係数 Corr(T, Y) (シミュレーション): {simulated_corr:.4f}")
print(f"相関係数 Corr(T, Y) (理論値): {theoretical_corr:.4f}")

# ヒストグラムの描画
plt.figure(figsize=(10, 6))
plt.hist(Y_given_X_positive, bins=50, density=True, color='lightblue', edgecolor='black', alpha=0.7, label="Y | X >= 0 の分布")
plt.axvline(simulated_mean, color="green", linestyle="--", label=f"シミュレーション期待値: {simulated_mean:.4f}")
plt.axvline(theoretical_mean, color="red", linestyle="--", label=f"理論期待値: {theoretical_mean:.4f}")

# グラフの設定
plt.title("条件付き期待値 E[Y | X >= 0] の確認", fontsize=14)
plt.xlabel("Y の値", fontsize=12)
plt.ylabel("確率密度", fontsize=12)
plt.legend(fontsize=10)
plt.grid(True)
plt.tight_layout()
plt.show()
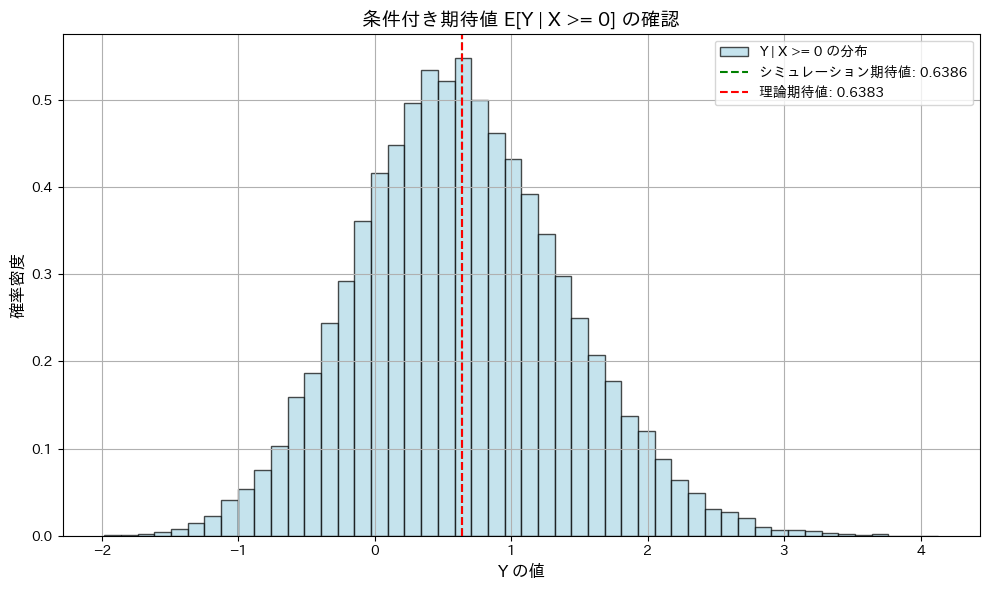
シミュレーション結果:
E[Y | X >= 0] (シミュレーション): 0.6386
E[Y | X >= 0] (理論値): 0.6383
相関係数 Corr(T, Y) (シミュレーション): 0.6384
相関係数 Corr(T, Y) (理論値): 0.6383
条件付期待値![]() と相関係数
と相関係数 ![]() が、共に理論値
が、共に理論値![]() に一致することが確認されました。
に一致することが確認されました。
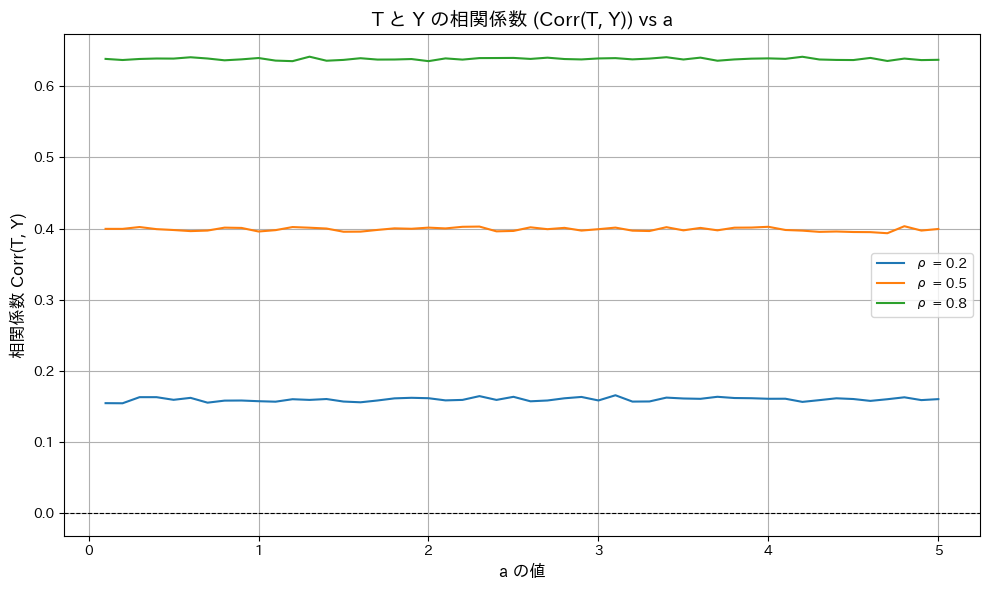
次に、相関係数 ![]() がaの値に依らず一定であることを確認します。また、いくつかの相関係数
がaの値に依らず一定であることを確認します。また、いくつかの相関係数![]() を変化させて確認します。
を変化させて確認します。
# 2015 Q5(6)  2024.12.27

import numpy as np
import matplotlib.pyplot as plt

# パラメータ設定
rho_values = [0.2, 0.5, 0.8]  # いくつかの相関係数 ρ
a_values = np.linspace(0.1, 5, 50)  # a の範囲
num_samples = 100000  # サンプル数

# 結果を格納する辞書
results = {rho: [] for rho in rho_values}

# シミュレーション
for rho in rho_values:
    mean = [0, 0]  # 平均
    cov = [[1, rho], [rho, 1]]  # 共分散行列

    for a in a_values:
        # 2次元正規分布の生成
        X, Y = np.random.multivariate_normal(mean, cov, num_samples).T

        # T の定義
        T = np.where(X >= 0, a, -a)

        # 相関係数の計算
        simulated_corr = np.corrcoef(T, Y)[0, 1]
        results[rho].append(simulated_corr)

# グラフの描画
plt.figure(figsize=(10, 6))
for rho, corr_values in results.items():
    plt.plot(a_values, corr_values, label=f"ρ = {rho}")

# 理論値の計算
theoretical_corr = np.sqrt(2 / np.pi) * np.array(rho_values)

# グラフの設定
plt.title("T と Y の相関係数 (Corr(T, Y)) vs a", fontsize=14)
plt.xlabel("a の値", fontsize=12)
plt.ylabel("相関係数 Corr(T, Y)", fontsize=12)
plt.axhline(y=0, color="black", linestyle="--", linewidth=0.8)  # 基準線
plt.legend(fontsize=10)
plt.grid(True)
plt.tight_layout()
plt.show()
相関係数 ![]() がaの値に依らず一定であることが確認されました。
がaの値に依らず一定であることが確認されました。