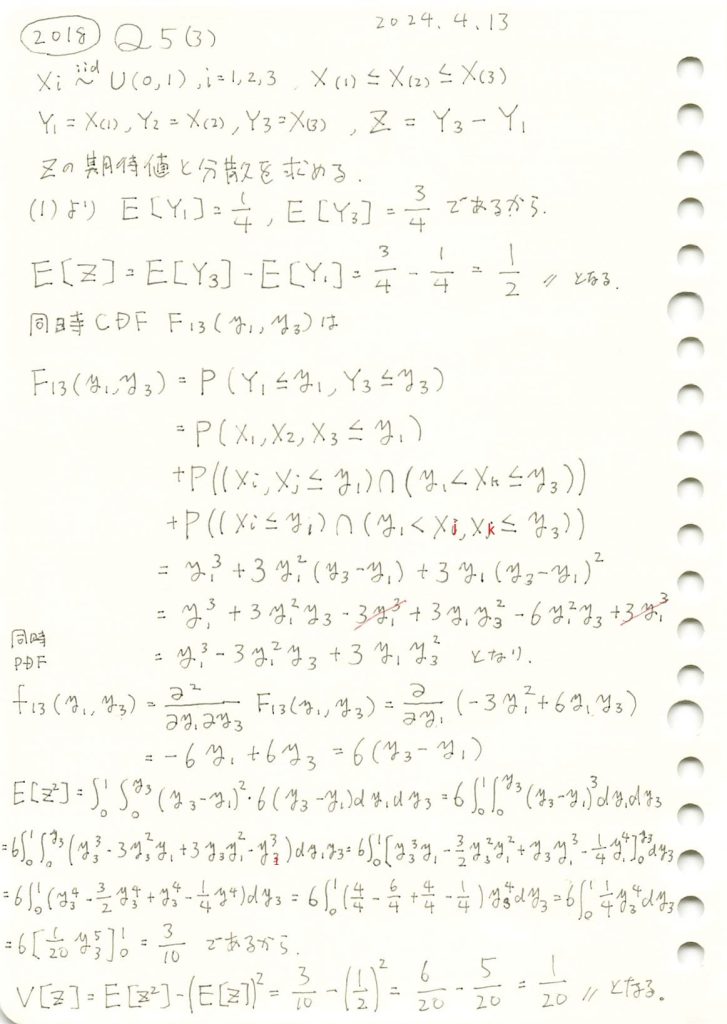
一様分布の3つの順序統計量のうち第3と第1の確率変数の差の期待値と分散を求めました。

コード
同時確率密度関数f13(y1,y3)を視覚化してみます。またzが一定になる線も描画してみます。
# 2018 Q5(3)  2024.10.23

import numpy as np
import matplotlib.pyplot as plt
from mpl_toolkits.mplot3d import Axes3D

# 定義域 (y1 と y3 は [0, 1] の範囲で変動)
y1_values = np.linspace(0, 1, 100)
y3_values = np.linspace(0, 1, 100)

# メッシュグリッドを作成
Y1, Y3 = np.meshgrid(y1_values, y3_values)

# 同時確率密度関数 f13(y1, y3) = 6(y3 - y1), ただし y3 >= y1
f13 = np.where(Y3 >= Y1, 6 * (Y3 - Y1), 0)

# 等高線のための Z の値を設定 (例として Z = 0.2, 0.5, 0.8 を使用)
Z_values = [0.2, 0.5, 0.8]

# 3D グラフの描画を再度行う
fig = plt.figure(figsize=(10, 8))
ax = fig.add_subplot(111, projection='3d')

# 3Dプロット (同時確率密度関数 f13(y1, y3))
ax.plot_surface(Y1, Y3, f13, cmap='viridis', alpha=0.8)

# 各 Z = Y3 - Y1 の線をプロット
for z_value in Z_values:
    y1_line = np.linspace(0, 1 - z_value, 100)
    y3_line = y1_line + z_value
    ax.plot(y1_line, y3_line, zs=0, zdir='z', label=f'$Z = {z_value}$', lw=2)

# 軸ラベル
ax.set_title('同時確率密度関数 $f_{13}(y_1, y_3)$ と $Z = Y_3 - Y_1$', fontsize=14)
ax.set_xlabel('$y_1$', fontsize=12)
ax.set_ylabel('$y_3$', fontsize=12)
ax.set_zlabel('$f_{13}(y_1, y_3)$', fontsize=12)

# 凡例
ax.legend()

# グラフの表示
plt.show()
Z=z で垂直に切った断面の面積が![]() に相当します。
に相当します。
![]() を解いてZの確率密度関数を
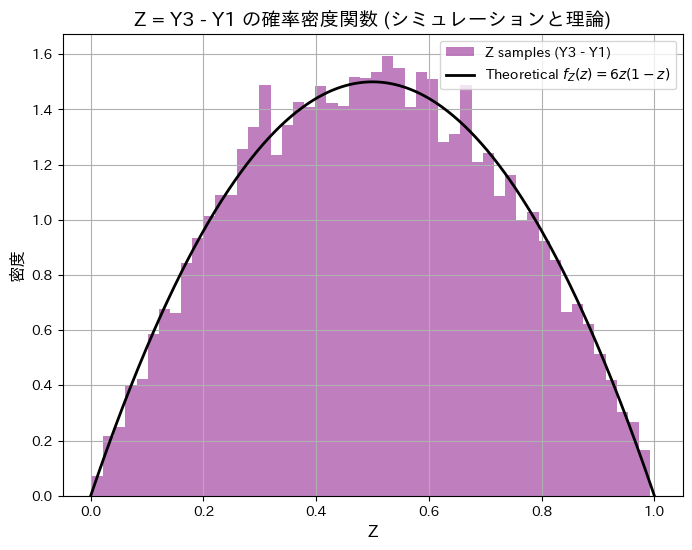
を解いてZの確率密度関数を![]() のように求めます。順序統計量Y1とY3をシミュレーションし、理論と一致するか確認します。
のように求めます。順序統計量Y1とY3をシミュレーションし、理論と一致するか確認します。
# 2018 Q5(3)  2024.10.23

import numpy as np
import matplotlib.pyplot as plt

# サンプルデータの生成 (Z = Y3 - Y1 としてシミュレーション)
n_samples = 10000  # サンプル数
samples = np.random.uniform(0, 1, (n_samples, 3))  # 一様分布からサンプリング
Y1_samples = np.min(samples, axis=1)  # 最小値 Y1
Y3_samples = np.max(samples, axis=1)  # 最大値 Y3

# Z = Y3 - Y1 を計算
Z_samples = Y3_samples - Y1_samples

# Zの期待値と分散を計算
expected_Z = np.mean(Z_samples)
variance_Z = np.var(Z_samples)

# 理論値との比較
theoretical_Z_mean = 0.5
theoretical_Z_var = 1/20

# 期待値と分散を表示
print(f"シミュレーションによる E[Z](期待値): {expected_Z:.4f}, 理論値: {theoretical_Z_mean:.4f}")
print(f"シミュレーションによる Var[Z](分散): {variance_Z:.4f}, 理論値: {theoretical_Z_var:.4f}")

# Zの理論的な確率密度関数の定義
z_values = np.linspace(0, 1, 500)
f_z_theoretical = 6 * z_values * (1 - z_values)

# ヒストグラムと理論的なPDFを重ねて描画
plt.figure(figsize=(8, 6))

# サンプルのヒストグラムを描画 (確率密度として正規化)
plt.hist(Z_samples, bins=50, density=True, alpha=0.5, color='purple', label='Z samples (Y3 - Y1)')

# 理論的な確率密度関数のプロット
plt.plot(z_values, f_z_theoretical, label='Theoretical $f_Z(z) = 6z(1-z)$', color='black', linewidth=2)

# グラフの設定
plt.title('Z = Y3 - Y1 の確率密度関数 (シミュレーションと理論)', fontsize=14)
plt.xlabel('Z', fontsize=12)
plt.ylabel('密度', fontsize=12)
plt.legend(loc='upper right', fontsize=10)
plt.grid(True)

# グラフの表示
plt.show()
シミュレーションによる E[Z](期待値): 0.4992, 理論値: 0.5000
シミュレーションによる Var[Z](分散): 0.0500, 理論値: 0.0500
シミュレーションによる順序統計量Y3とY1の差の分布と期待値と分散が理論値と一致しました。
また興味深いことに、ZとY2は同じ分布になっていることが分かりました。