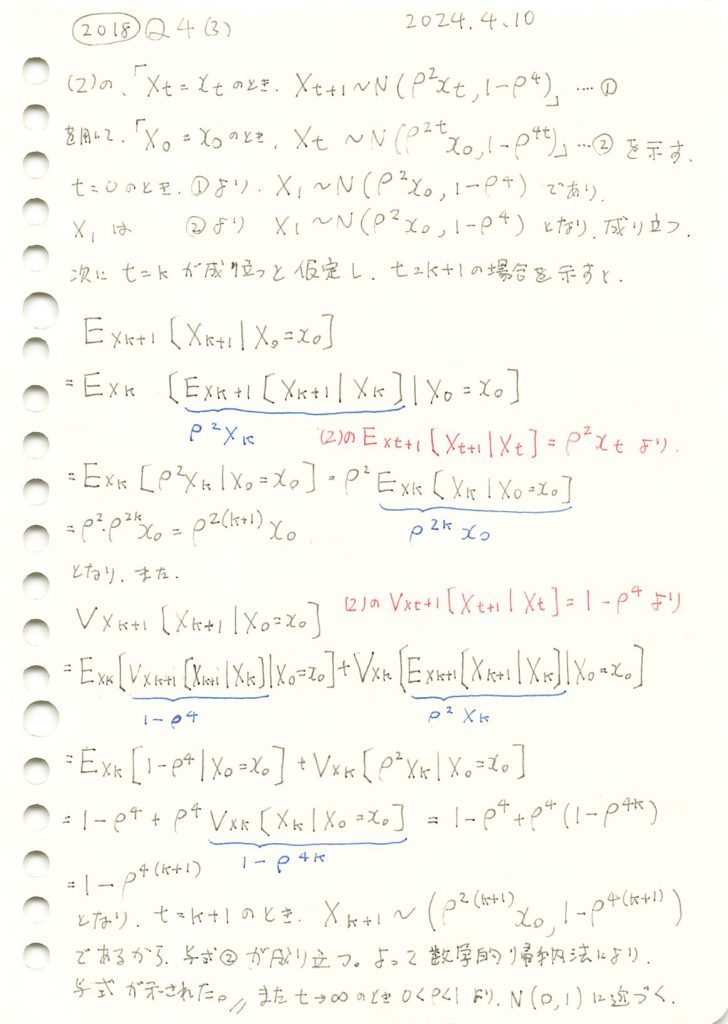
マルコフ連鎖する条件付き正規分布の任意のtに対する分布の証明をやりました。

コード
![]() の条件付き分布が
の条件付き分布が![]() に従うのかシミュレーションをしてみます。
に従うのかシミュレーションをしてみます。
# 2018 Q4(3)  2024.10.20

import numpy as np
import matplotlib.pyplot as plt

# パラメータ設定
t_max = 50  # 時間 t の最大値
n_simulations = 10000  # シミュレーション回数
rho = 0.7  # ρの値
x_0 = 1.0  # X_0 の初期値

# シミュレーション結果を格納するリスト
X_t_samples = np.zeros((t_max, n_simulations))
X_t_samples[0, :] = x_0  # X_0 = x_0

# マルコフプロセスをシミュレーション
for t in range(1, t_max):
    # X_t を次のステップで生成
    mean = rho**2 * X_t_samples[t-1, :]
    variance = 1 - rho**4
    X_t_samples[t, :] = np.random.normal(loc=mean, scale=np.sqrt(variance), size=n_simulations)

# シミュレーション結果の平均と分散を計算
simulated_means = np.mean(X_t_samples, axis=1)
simulated_variances = np.var(X_t_samples, axis=1)

# 理論値の期待値と分散を計算
theoretical_means = rho**(2 * np.arange(t_max)) * x_0
theoretical_variances = 1 - rho**(4 * np.arange(t_max))

# グラフを描画
plt.figure(figsize=(10, 6))

# 期待値のプロット
plt.subplot(2, 1, 1)
plt.plot(np.arange(t_max), simulated_means, label="シミュレーション期待値", color='blue', linestyle='--')
plt.plot(np.arange(t_max), theoretical_means, label="理論期待値", color='red')
plt.title("期待値の推移")
plt.xlabel("時間 t")
plt.ylabel("期待値 E[X_t]")
plt.legend()
plt.grid(True)

# 分散のプロット
plt.subplot(2, 1, 2)
plt.plot(np.arange(t_max), simulated_variances, label="シミュレーション分散", color='blue', linestyle='--')
plt.plot(np.arange(t_max), theoretical_variances, label="理論分散", color='red')
plt.title("分散の推移")
plt.xlabel("時間 t")
plt.ylabel("分散 Var[X_t]")
plt.legend()
plt.grid(True)

# グラフを表示
plt.tight_layout()
plt.show()
シミュレーションと理論値は一致しました。