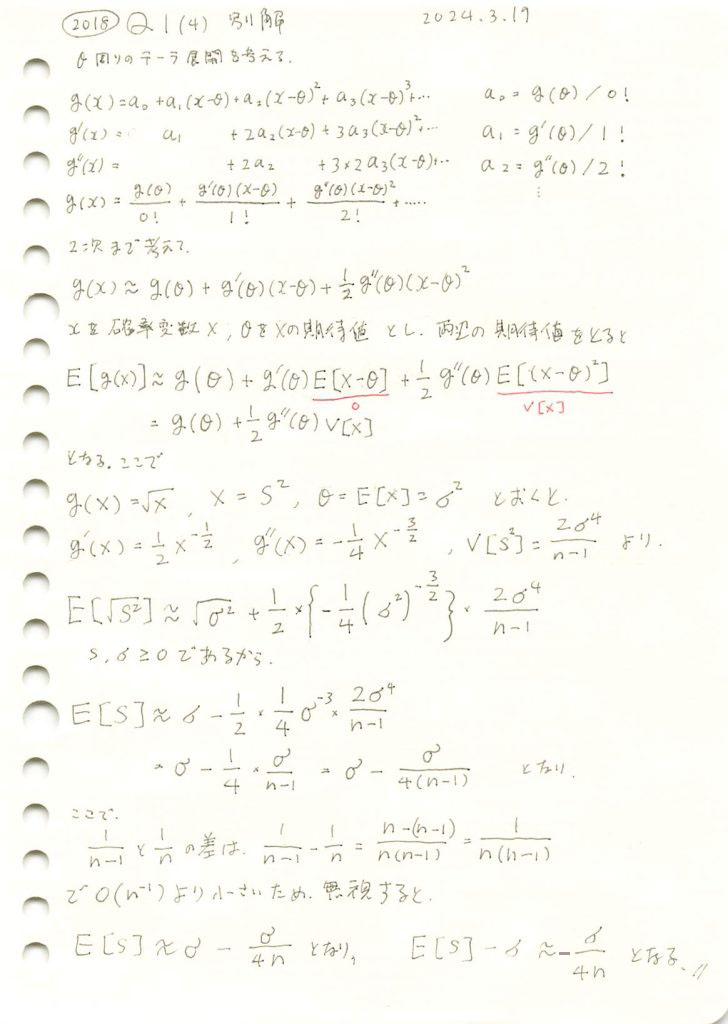
(別解)不偏分散の平方根の期待値の母標準偏差に対する偏りを求めました。

コード
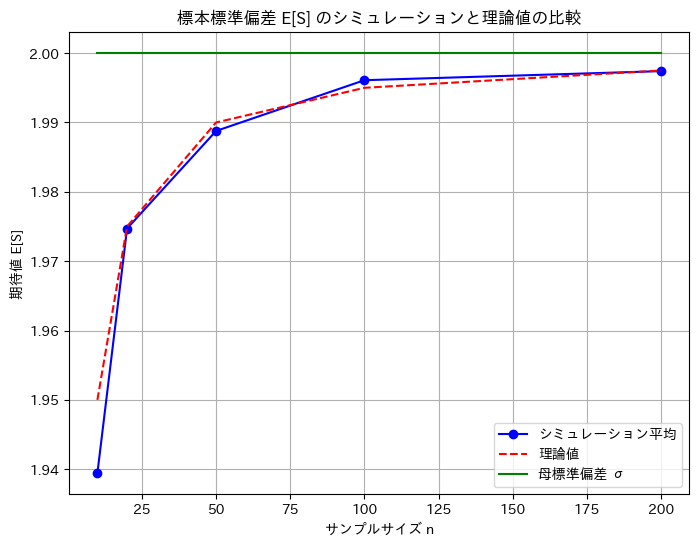
数値シミュレーションでE[S] 求め、理論値![]() と一致するか確認します。
と一致するか確認します。
import numpy as np
import matplotlib.pyplot as plt

# パラメータ設定
sigma = 2  # 母標準偏差
n_values = np.array([10, 20, 50, 100, 200])  # サンプルサイズの値
num_simulations = 10000  # シミュレーションの回数

# 結果を格納するリスト
simulated_means = []
theoretical_means = []
sigma_values = [sigma] * len(n_values)  # 母標準偏差の値をリストで作成

# シミュレーション実行
for n in n_values:
    # カイ二乗分布に従う乱数を生成
    chi_squared_samples = np.random.chisquare(df=n-1, size=num_simulations)

    # 標本標準偏差 S のシミュレーション
    S_simulation = sigma * np.sqrt(chi_squared_samples / (n - 1))

    # シミュレーションの期待値 (平均)
    simulated_mean = np.mean(S_simulation)
    simulated_means.append(simulated_mean)

    # 理論値 E[S] = σ - σ / (4n)
    theoretical_mean = sigma - sigma / (4 * n)
    theoretical_means.append(theoretical_mean)

# 結果表示
for i, n in enumerate(n_values):
    print(f"n = {n}: シミュレーション平均 = {simulated_means[i]:.4f}, 理論値 = {theoretical_means[i]:.4f}, 母標準偏差 = {sigma:.4f}")

# グラフ描画
plt.figure(figsize=(8, 6))
plt.plot(n_values, simulated_means, 'bo-', label='シミュレーション平均')
plt.plot(n_values, theoretical_means, 'r--', label='理論値')
plt.plot(n_values, sigma_values, 'g-', label='母標準偏差 σ')
plt.xlabel('サンプルサイズ n')
plt.ylabel('期待値 E[S]')
plt.title('標本標準偏差 E[S] のシミュレーションと理論値の比較')
plt.legend()
plt.grid(True)
plt.show()
n = 10: シミュレーション平均 = 1.9394, 理論値 = 1.9500, 母標準偏差 = 2.0000
n = 20: シミュレーション平均 = 1.9747, 理論値 = 1.9750, 母標準偏差 = 2.0000
n = 50: シミュレーション平均 = 1.9888, 理論値 = 1.9900, 母標準偏差 = 2.0000
n = 100: シミュレーション平均 = 1.9961, 理論値 = 1.9950, 母標準偏差 = 2.0000
n = 200: シミュレーション平均 = 1.9974, 理論値 = 1.9975, 母標準偏差 = 2.0000
数値シミュレーションでのE[S]は、理論値![]() に一致することが確認できました。
に一致することが確認できました。