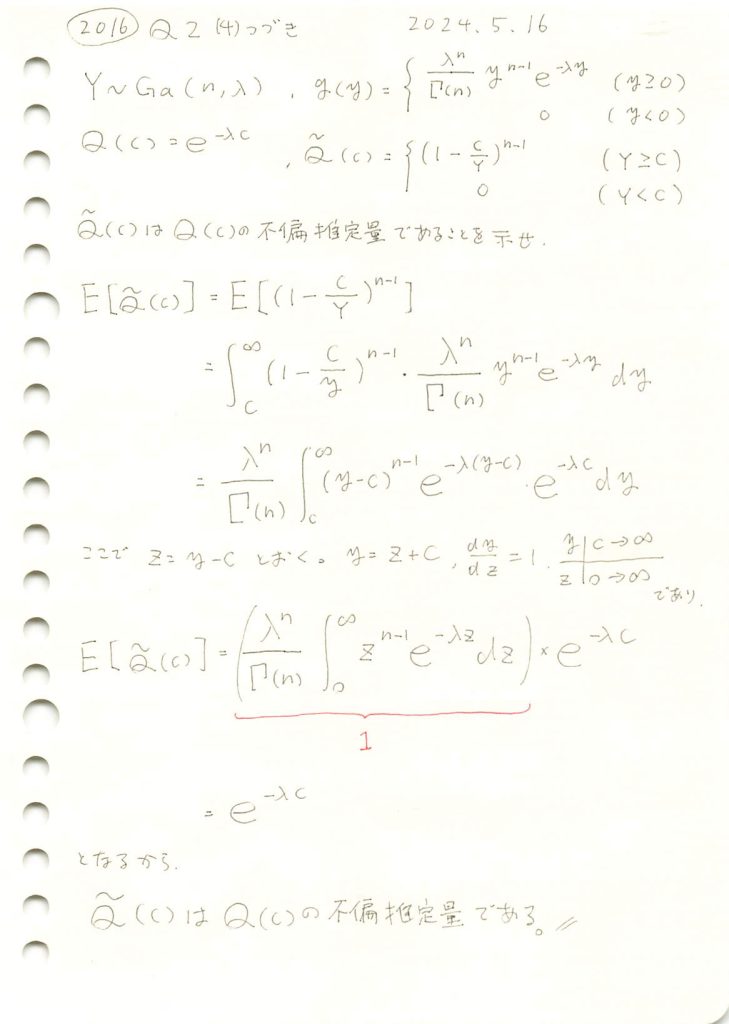
指数分布の上側確率の推定量が、ガンマ分布に従う確率変数の式で表され、それが不偏推定量であることを示しました。

コード
![]() はnによらず
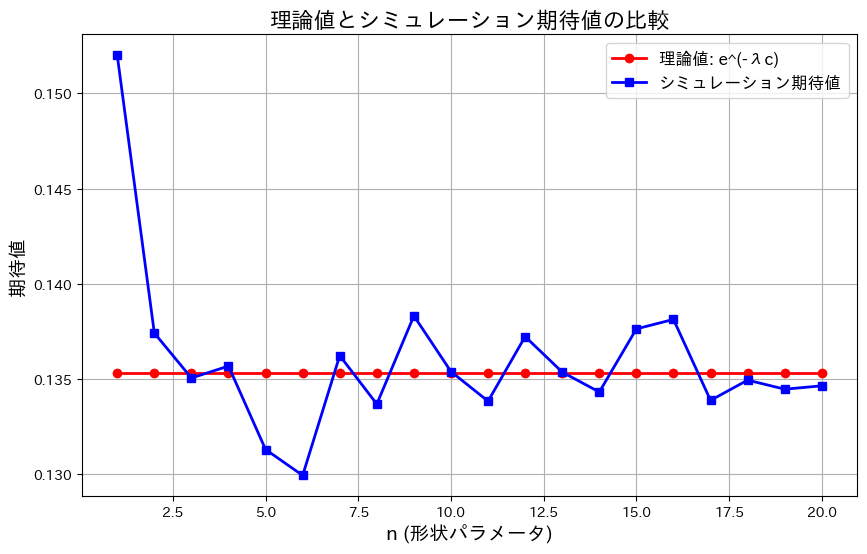
はnによらず![]() に近づきます。nを1~20に変化させてシミュレーションして確認してみます。
に近づきます。nを1~20に変化させてシミュレーションして確認してみます。
# 2016 Q2(4)  2024.11.19

import numpy as np
import matplotlib.pyplot as plt

# パラメータ設定
lambda_value = 2  # 固定されたλ
c = 1.0  # 定数c
n_values = range(1, 21)  # nを1から20まで変化させる
sample_size = 1000  # シミュレーションのサンプルサイズ

simulated_expectations = []  # シミュレーション期待値を格納するリスト
theoretical_expectations = []  # 理論値を格納するリスト

# 修正版コード
for n in n_values:
    # ガンマ分布のサンプルを生成 (Y ~ Gamma(n, λ))
    Y_samples = np.random.gamma(shape=n, scale=1/lambda_value, size=sample_size)

    # 条件付きで (1 - c/Y)^(n-1) を計算
    values = np.where(Y_samples >= c, (1 - c / Y_samples)**(n - 1), 0)

    # シミュレーション期待値を計算
    simulated_expectations.append(np.mean(values))

    # 理論値 e^(-λc) を計算
    theoretical_expectations.append(np.exp(-lambda_value * c))

# グラフの描画
plt.figure(figsize=(10, 6))
plt.plot(n_values, theoretical_expectations, 'r-o', label='理論値: e^(-λc)', linewidth=2)
plt.plot(n_values, simulated_expectations, 'b-s', label='シミュレーション期待値', linewidth=2)

# グラフの設定
plt.title('理論値とシミュレーション期待値の比較 (n を変化)', fontsize=16)
plt.xlabel('n (形状パラメータ)', fontsize=14)
plt.ylabel('期待値', fontsize=14)
plt.legend(fontsize=12)
plt.grid(True)

# プロットの表示
plt.show()
![]() はnによらず
はnによらず![]() に近づきました。グラフの縦軸の範囲が0.13~0.15と非常に狭いため、誤差が拡大して表示されているように見えます。実際の差異はごくわずかです。
に近づきました。グラフの縦軸の範囲が0.13~0.15と非常に狭いため、誤差が拡大して表示されているように見えます。実際の差異はごくわずかです。