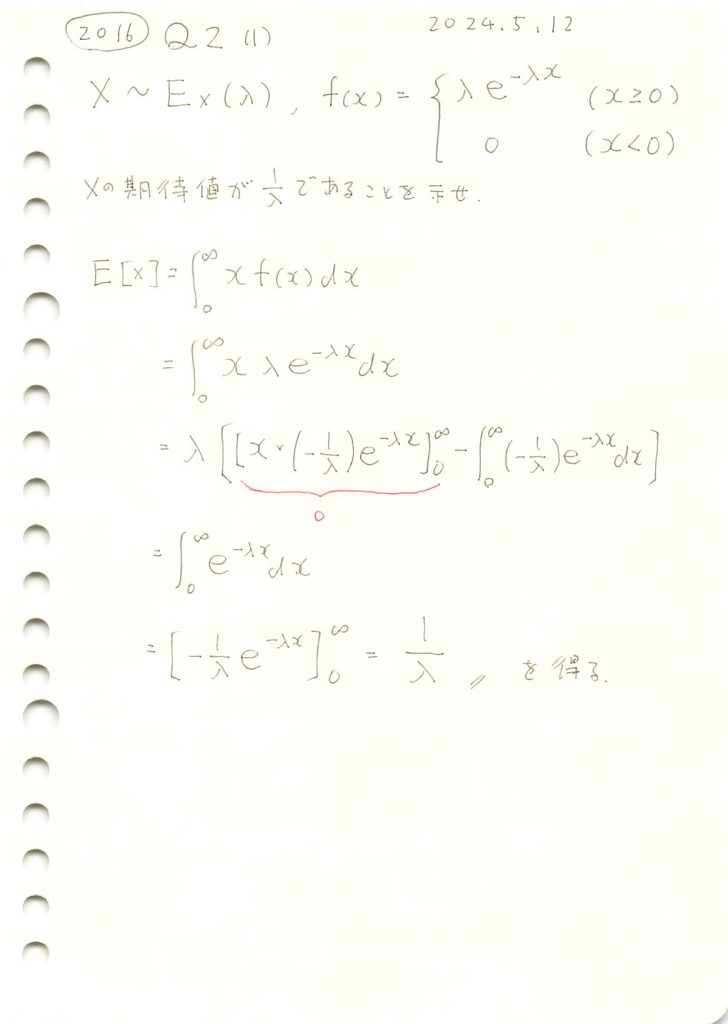
指数分布の期待値を求めました。

コード
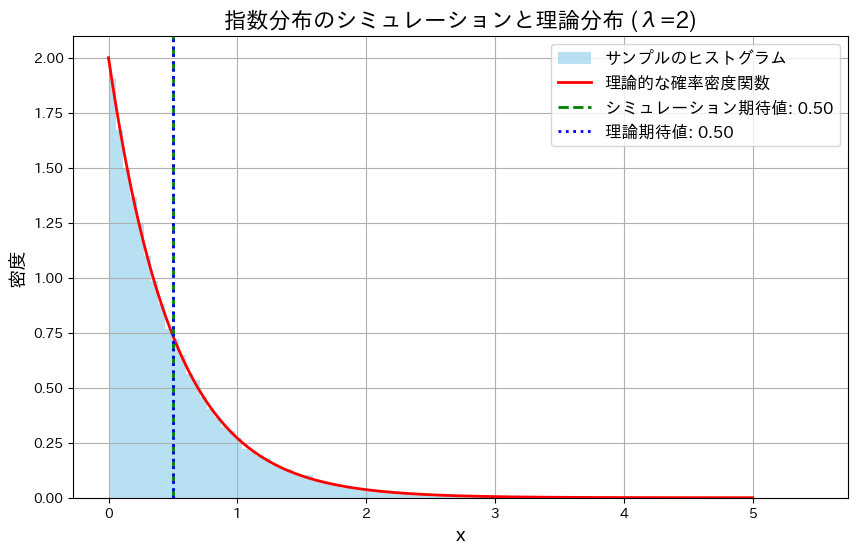
指数分布Exp(λ)に従うXの確率密度関数を![]() とするとき、Xのシミュレーションを行い、その分布のヒストグラムと理論的な確率密度関数のグラフを重ねて描画してみます。λ=2とします。
とするとき、Xのシミュレーションを行い、その分布のヒストグラムと理論的な確率密度関数のグラフを重ねて描画してみます。λ=2とします。
# 2016 Q2(1)  2024.11.15

import numpy as np
import matplotlib.pyplot as plt

# シミュレーションとプロット
def simulate_and_plot_exponential(lambda_value=2, sample_size=50000, bins=100):
    # 指数分布に従う乱数を生成
    random_samples = np.random.exponential(scale=1/lambda_value, size=sample_size)

    # 理論的な確率密度関数を計算
    x = np.linspace(0, 5, 1000)
    theoretical_pdf = lambda_value * np.exp(-lambda_value * x)

    # サンプルのヒストグラムを描画
    plt.figure(figsize=(10, 6))
    plt.hist(random_samples, bins=bins, density=True, alpha=0.6, color='skyblue', label='サンプルのヒストグラム')

    # 理論的な確率密度関数を重ねる
    plt.plot(x, theoretical_pdf, 'r-', label='理論的な確率密度関数', linewidth=2)

    # 期待値を計算
    simulated_mean = np.mean(random_samples)
    theoretical_mean = 1 / lambda_value

    # 期待値を直線でプロット
    plt.axvline(simulated_mean, color='green', linestyle='dashed', linewidth=2, label=f'シミュレーション期待値: {simulated_mean:.2f}')
    plt.axvline(theoretical_mean, color='blue', linestyle='dotted', linewidth=2, label=f'理論期待値: {theoretical_mean:.2f}')

    # グラフの設定
    plt.title(f'指数分布のシミュレーションと理論分布 (λ={lambda_value})', fontsize=16)
    plt.xlabel('x', fontsize=14)
    plt.ylabel('密度', fontsize=14)
    plt.legend(fontsize=12)
    plt.grid(True)

    # プロットを表示
    plt.show()

# 実行
simulate_and_plot_exponential()
Xの分布は、確率密度関数![]() とよく一致しており、シミュレーションで得られた期待値も理論値に非常に近い値となりました。
とよく一致しており、シミュレーションで得られた期待値も理論値に非常に近い値となりました。
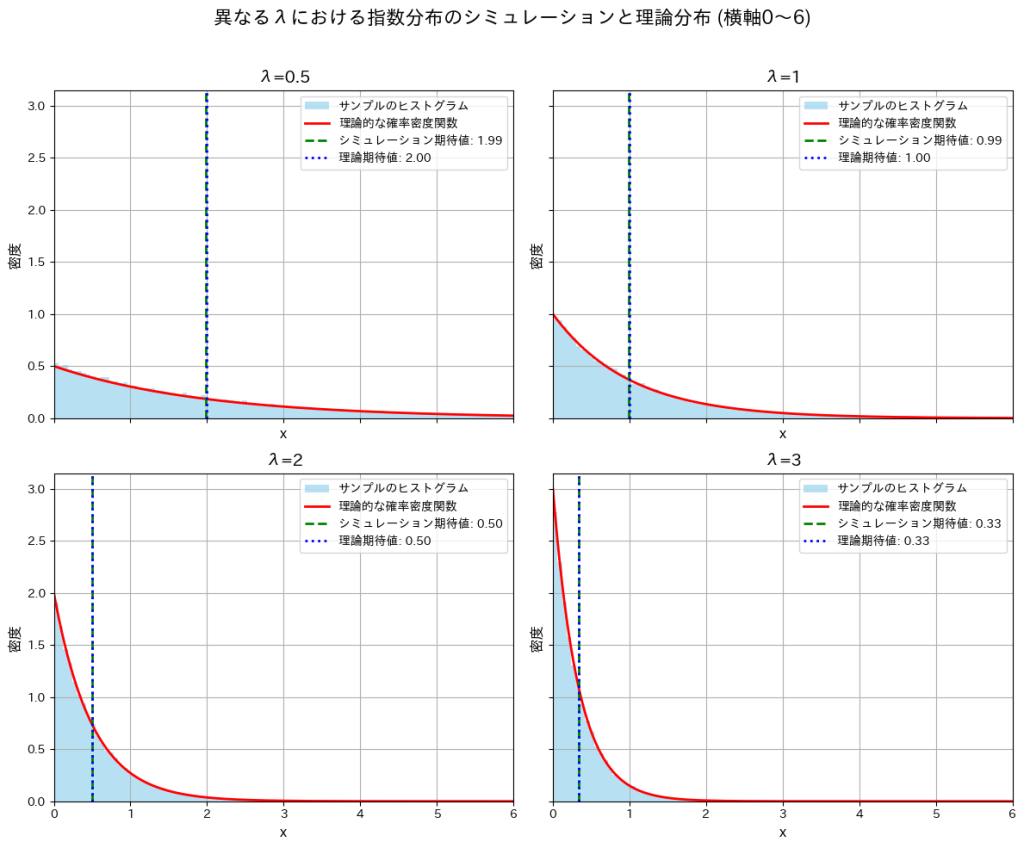
では、次にλを変化させて同様の実験を行い、グラフの形状の変化と期待値がどのように変化するかを確認します。
# 2016 Q2(1)  2024.11.15

import numpy as np
import matplotlib.pyplot as plt

# シミュレーションとプロット
def simulate_and_plot_adjusted_lambdas(lambdas=[0.5, 1, 2, 3], sample_size=50000, bins=100):
    fig, axes = plt.subplots(2, 2, figsize=(12, 10), sharex=True, sharey=True)
    x = np.linspace(0, 6, 1000)  # 横軸の範囲を0~6に限定

    for i, lambda_value in enumerate(lambdas):
        row, col = divmod(i, 2)
        ax = axes[row, col]

        # 乱数生成と理論値計算
        random_samples = np.random.exponential(scale=1/lambda_value, size=sample_size)
        theoretical_pdf = lambda_value * np.exp(-lambda_value * x)

        # ヒストグラムと理論分布
        ax.hist(random_samples, bins=bins, range=(0, 6), density=True, alpha=0.6, color='skyblue', label='サンプルのヒストグラム')
        ax.plot(x, theoretical_pdf, 'r-', label='理論的な確率密度関数', linewidth=2)

        # 期待値を計算してプロット
        simulated_mean = np.mean(random_samples)
        theoretical_mean = 1 / lambda_value
        ax.axvline(simulated_mean, color='green', linestyle='dashed', linewidth=2, label=f'シミュレーション期待値: {simulated_mean:.2f}')
        ax.axvline(theoretical_mean, color='blue', linestyle='dotted', linewidth=2, label=f'理論期待値: {theoretical_mean:.2f}')

        # グラフ設定
        ax.set_xlim(0, 6)  # 横軸を0~6に限定
        ax.set_title(f'λ={lambda_value}', fontsize=14)
        ax.set_xlabel('x', fontsize=12)
        ax.set_ylabel('密度', fontsize=12)
        ax.legend(fontsize=10)
        ax.grid(True)

    # 全体のタイトルと調整
    plt.suptitle('異なるλにおける指数分布のシミュレーションと理論分布', fontsize=16)
    plt.tight_layout(rect=[0, 0, 1, 0.96])  # タイトルとの重なり防止
    plt.show()

# 実行
simulate_and_plot_adjusted_lambdas()
λが大きくなるにつれて分布の形状は急こう配になり期待値が小さくなることが確認できました。λの増加によって小さい値が観測される確率が高くなるためだと考えられます。