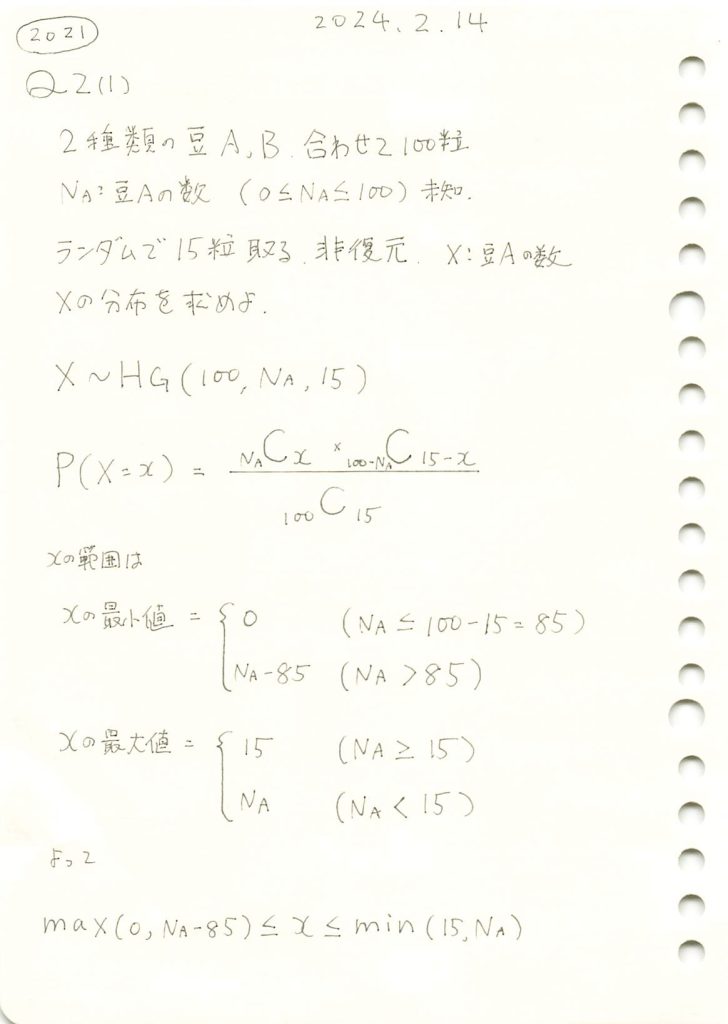
超幾何分布の問題をやりました。

コード
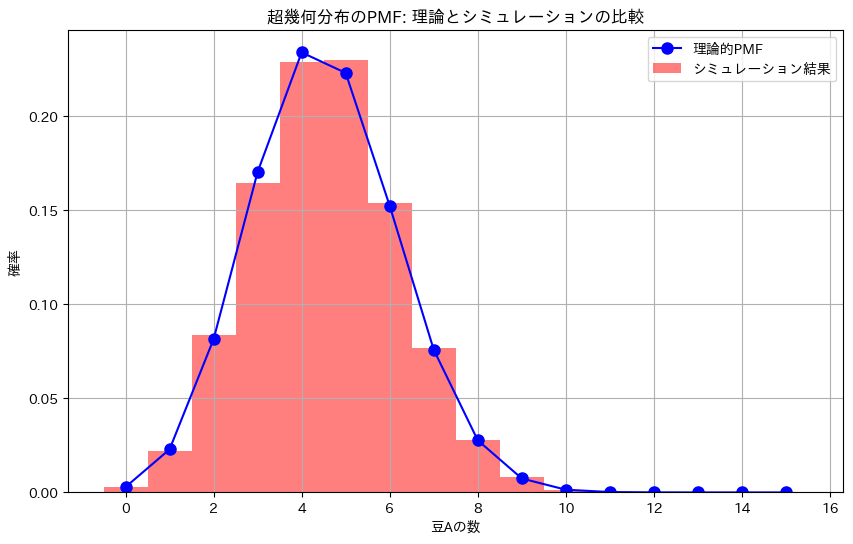
シミュレーションによる計算
# 2021 Q2(1)  2024.8.21

import numpy as np
import matplotlib.pyplot as plt
from scipy.stats import hypergeom

# パラメータの設定
M = 100        # 全体の豆の数
N_A = 30       # 豆Aの数
n = 15         # 抽出する豆の数
x_values = np.arange(0, n+1)  # 可能な豆Aの数

# 理論的な超幾何分布のPMFを計算
rv = hypergeom(M, N_A, n)
pmf_theoretical = rv.pmf(x_values)

# 数値シミュレーションの設定
n_simulations = 10000  # シミュレーション回数
simulated_counts = []

# シミュレーションの実行
for _ in range(n_simulations):
    # 袋の中の豆を表すリスト(1が豆A、0が豆B)
    bag = np.array([1]*N_A + [0]*(M - N_A))
    # 無作為に15個抽出
    sample = np.random.choice(bag, size=n, replace=False)
    # 抽出した中の豆Aの数をカウント
    count_A = np.sum(sample)
    simulated_counts.append(count_A)

# シミュレーションから得られたPMFを計算
pmf_simulated, bins = np.histogram(simulated_counts, bins=np.arange(-0.5, n+1.5, 1), density=True)

# グラフの描画
plt.figure(figsize=(10, 6))

# 理論的なPMFの描画
plt.plot(x_values, pmf_theoretical, 'bo-', label='理論的PMF', markersize=8)

# シミュレーション結果をヒストグラムとして描画
plt.hist(simulated_counts, bins=np.arange(-0.5, n+1.5, 1), density=True, alpha=0.5, color='red', label='シミュレーション結果')

# グラフの設定
plt.xlabel('豆Aの数')
plt.ylabel('確率')
plt.title('超幾何分布のPMF: 理論とシミュレーションの比較')
plt.legend()
plt.grid(True)
plt.show()