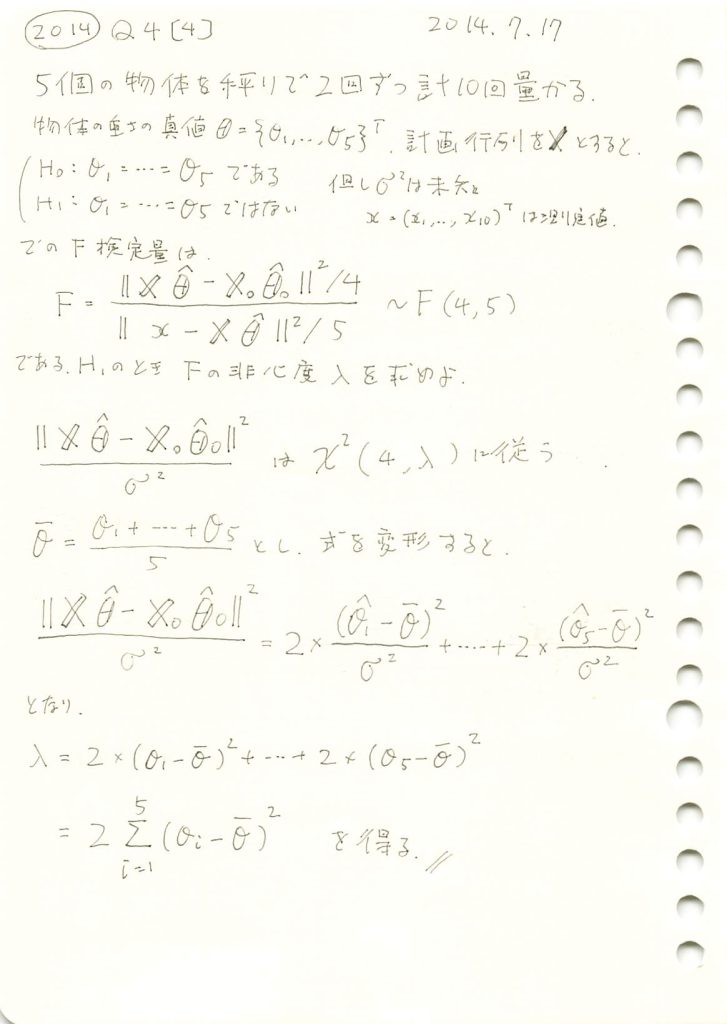
5個の物体の重さを1つずつ2回量る場合で、誤差の分散を未知とし、全ての物体の重さが等しいとはいえないとする対立仮説のF検定量の非心度を求めました。

コード
真の値![]() から
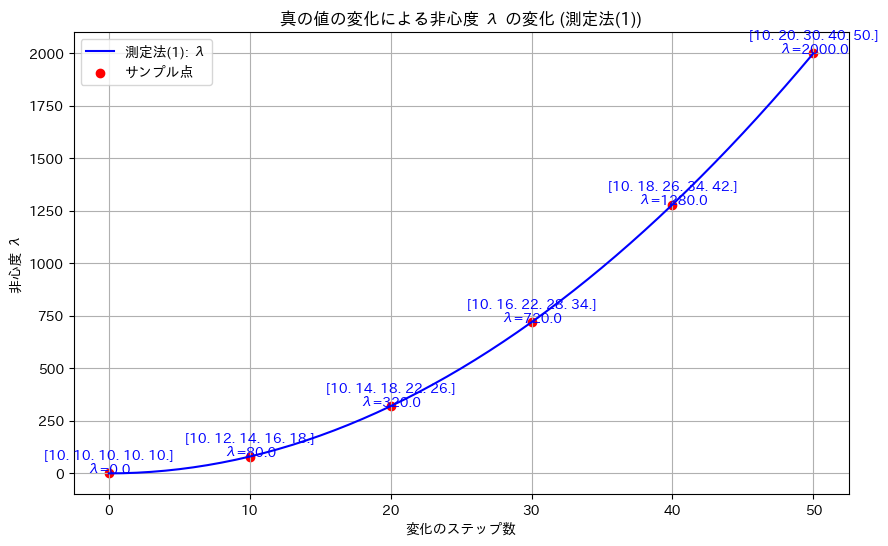
から![]() へ徐々に変化させて、非心度λを計算し、その変化をグラフにプロットしてみます。
へ徐々に変化させて、非心度λを計算し、その変化をグラフにプロットしてみます。
# 2014 Q4(4)  2025.1.12

import numpy as np
import matplotlib.pyplot as plt

# 初期設定
theta_initial = np.array([10, 10, 10, 10, 10])  # 初期の真の値
theta_final = np.array([10, 20, 30, 40, 50])  # 最終的な真の値
steps = 50  # 変化のステップ数

# θを徐々に変化させる
theta_values = [theta_initial + (theta_final - theta_initial) * t / steps for t in range(steps + 1)]

# 非心度 λ を計算 (測定法(1): 係数は2)
lambdas_1 = [2 * np.sum((theta - np.mean(theta)) ** 2) for theta in theta_values]

# サンプルのインデックス(途中でいくつかの点を表示)
sample_indices = [0, 10, 20, 30, 40, 50]

# 真の値と対応する λ を取得 (測定法(1))
sample_theta_values = [theta_values[i] for i in sample_indices]
sample_lambdas_1 = [lambdas_1[i] for i in sample_indices]

# 視覚化
plt.figure(figsize=(10, 6))
plt.plot(range(steps + 1), lambdas_1, label="測定法(1): λ", color="blue")
plt.scatter(sample_indices, sample_lambdas_1, color="red", label="サンプル点")
for i, (theta, lam) in enumerate(zip(sample_theta_values, sample_lambdas_1)):
    plt.text(sample_indices[i], lam, f"{np.round(theta, 1)}\nλ={lam:.1f}",
             fontsize=10, ha="center", color="blue")

# グラフの設定
plt.xlabel("変化のステップ数")
plt.ylabel("非心度 λ")
plt.title("真の値の変化による非心度 λ の変化 (測定法(1))")
plt.legend()
plt.grid()
plt.show()
真の値![]() のばらつきが大きくなるにつれて、非心度λも非線形的に増加することが確認できました。
のばらつきが大きくなるにつれて、非心度λも非線形的に増加することが確認できました。