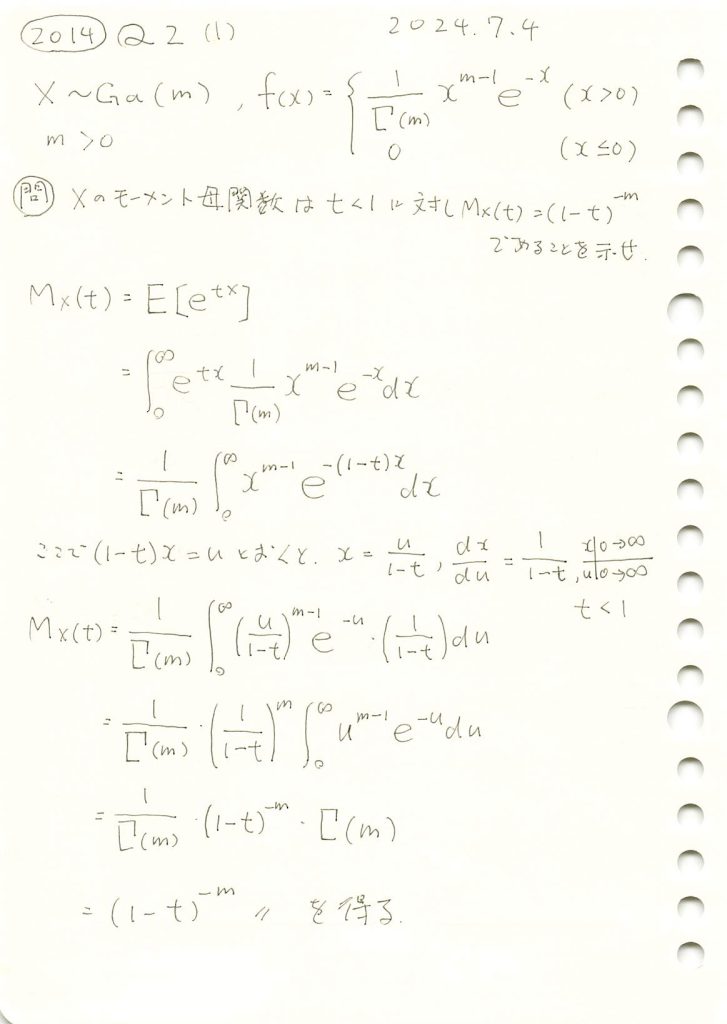
ガンマ分布のモーメント母関数を求めました。

コード
求めたモーメント母関数を用いてガンマ分布の期待値と分散の理論値を求め、それをシミュレーション結果と一致するか確認します。
# 2014 Q2(1)  2024.12.31

import numpy as np
import matplotlib.pyplot as plt
from scipy.stats import gamma
import sympy as sp
from IPython.display import display

# モーメント母関数を定義 (シンボリック)
t, m = sp.symbols('t m', real=True, positive=True)
M_X_t = (1 - t)**(-m)  # モーメント母関数

# 期待値 (モーメント母関数の一次微分を t=0 に代入)
M_X_prime = sp.diff(M_X_t, t)
theoretical_mean_expr = M_X_prime.subs(t, 0)

# 分散 (モーメント母関数の二次微分を t=0 に代入し、期待値の2乗を引く)
M_X_double_prime = sp.diff(M_X_prime, t)
theoretical_variance_expr = M_X_double_prime.subs(t, 0) - theoretical_mean_expr**2

# 理論値をシンボリックに表示
print("理論値の計算式:")
print("期待値 (モーメント母関数の一次微分を t=0 に代入):")
display(theoretical_mean_expr)
print("\n分散 (モーメント母関数の二次微分を t=0 に代入し、期待値の2乗を引く):")
display(theoretical_variance_expr)

# 実際のシミュレーション
m_values = [1, 2, 5, 10]  # ガンマ分布の形状パラメータ
num_samples = 10000  # 乱数のサンプル数

# 理論値とシミュレーション結果を格納するリスト
theoretical_means = []
theoretical_variances = []
simulated_means = []
simulated_variances = []

for m_val in m_values:
    # 理論値の計算
    mean_value = float(theoretical_mean_expr.subs(m, m_val))
    variance_value = float(theoretical_variance_expr.subs(m, m_val))
    theoretical_means.append(mean_value)
    theoretical_variances.append(variance_value)

    # シミュレーション (乱数生成)
    random_samples = gamma.rvs(a=m_val, scale=1, size=num_samples)  # scale=1 に対応
    simulated_mean = np.mean(random_samples)
    simulated_variance = np.var(random_samples)
    simulated_means.append(simulated_mean)
    simulated_variances.append(simulated_variance)

# グラフの描画 (期待値)
plt.figure(figsize=(10, 6))
plt.plot(m_values, theoretical_means, 'o-', label="理論値 (期待値)", color="blue", linewidth=2)
plt.plot(m_values, simulated_means, 's--', label="シミュレーション (期待値)", color="orange", linewidth=2)
plt.title("期待値の比較 (理論値 vs シミュレーション)", fontsize=16)
plt.xlabel("形状パラメータ $m$", fontsize=14)
plt.ylabel("期待値", fontsize=14)
plt.legend(fontsize=12)
plt.grid()
plt.show()

# グラフの描画 (分散)
plt.figure(figsize=(10, 6))
plt.plot(m_values, theoretical_variances, 'o-', label="理論値 (分散)", color="blue", linewidth=2)
plt.plot(m_values, simulated_variances, 's--', label="シミュレーション (分散)", color="orange", linewidth=2)
plt.title("分散の比較 (理論値 vs シミュレーション)", fontsize=16)
plt.xlabel("形状パラメータ $m$", fontsize=14)
plt.ylabel("分散", fontsize=14)
plt.legend(fontsize=12)
plt.grid()
plt.show()


モーメント母関数を用いてガンマ分布の期待値と分散の理論値は、シミュレーション結果がよく一致しました。