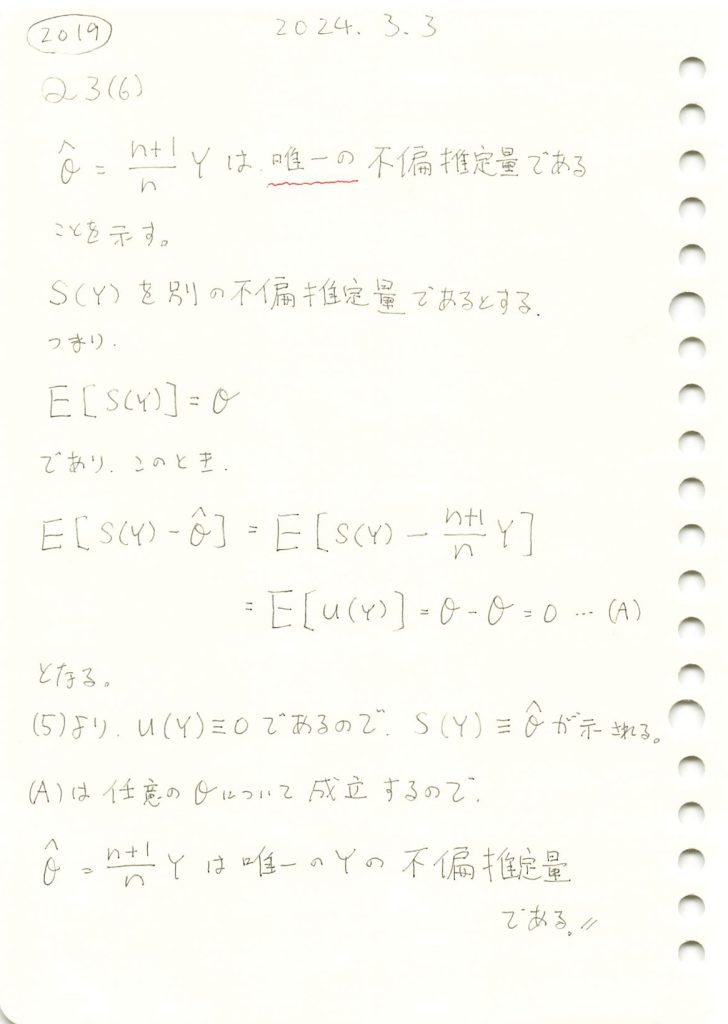
唯一の不偏推定量であることを示しました。

コード
![]() は、Yによるθの唯一の不偏推定量になります。またYはθの十分統計量ですから、完備十分統計量となります。よって、
は、Yによるθの唯一の不偏推定量になります。またYはθの十分統計量ですから、完備十分統計量となります。よって、![]() は、最小分散不偏推定量(UMVUE)となります。他のθの推定量
は、最小分散不偏推定量(UMVUE)となります。他のθの推定量![]() と一緒にプロットし分散を確認します。
と一緒にプロットし分散を確認します。
import numpy as np
import matplotlib.pyplot as plt

# パラメータ設定
theta_true = 10  # 真のθ
n = 10  # サンプルサイズ
num_simulations = 10000  # シミュレーション回数

# UMVUE(最大値を使った推定量)の格納リスト
theta_hat_UMVUE_list = []

# 他の推定量(例えば、平均を使った推定量)の格納リスト
theta_hat_mean_list = []

# シミュレーション開始
for _ in range(num_simulations):
    # U(0, theta_true) から n 個の乱数を生成
    samples = np.random.uniform(0, theta_true, n)

    # 最大値 Y を使用して UMVUE を計算
    Y = np.max(samples)
    theta_hat_UMVUE = (n + 1) / n * Y
    theta_hat_UMVUE_list.append(theta_hat_UMVUE)

    # 平均を使用して他の推定量を計算
    theta_hat_mean = 2 * np.mean(samples)
    theta_hat_mean_list.append(theta_hat_mean)

# UMVUE 推定量の分散を計算
umvue_variance = np.var(theta_hat_UMVUE_list)

# 平均推定量の分散を計算
mean_variance = np.var(theta_hat_mean_list)

# 結果を表示
print(f"UMVUE(最大値を使った推定量)の分散: {umvue_variance}")
print(f"平均を使った推定量の分散: {mean_variance}")

# 推定量の分布をプロット
plt.hist(theta_hat_UMVUE_list, bins=30, alpha=0.7, label='UMVUE(最大値を使用)', color='blue', edgecolor='black', density=True)
plt.hist(theta_hat_mean_list, bins=30, alpha=0.7, label='平均を使用した推定量', color='red', edgecolor='black', density=True)
plt.title('UMVUE(最大値)と平均推定量の分布比較')
plt.xlabel('推定量の値')
plt.ylabel('密度')
plt.legend()
plt.grid(True)
plt.show()
UMVUE(最大値を使った推定量)の分散: 0.8726264971281747
平均を使った推定量の分散: 3.3430162264024963
![]() の分散は、
の分散は、![]() の分散よりも小さいことが確認できました。
の分散よりも小さいことが確認できました。