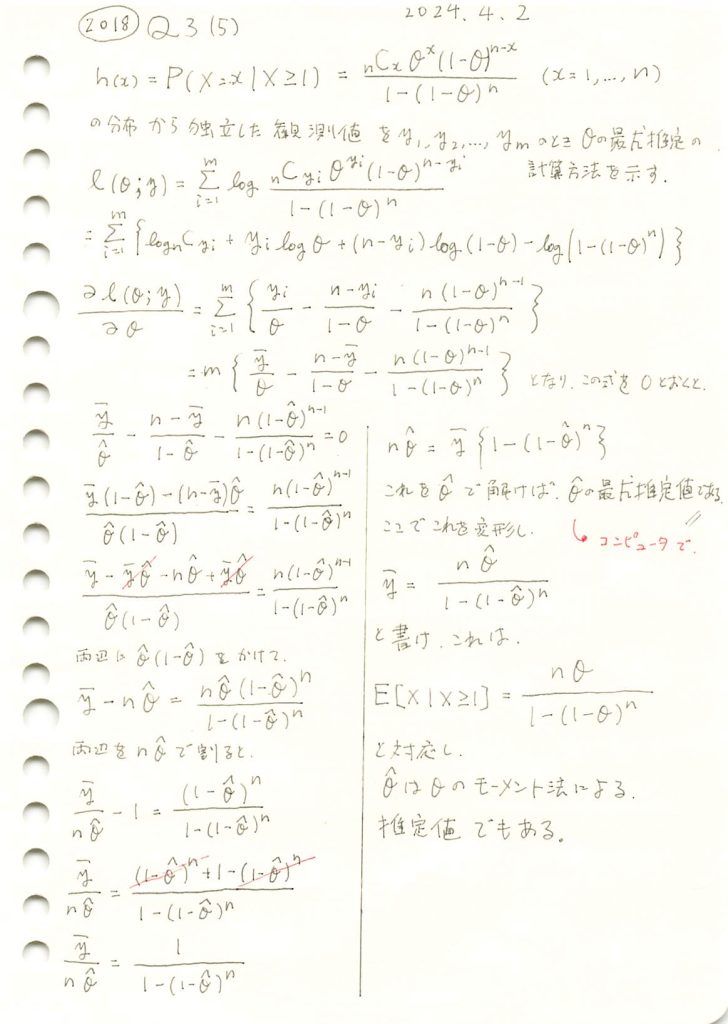
二項分布の条件付き確率質量関数のパラメータの最尤推定の問題をやりました。

コード
![]() として、
として、 ![]() より
より![]() を求めます。まずはfsolveを使用してモーメント法による推定値を求めてみます。
を求めます。まずはfsolveを使用してモーメント法による推定値を求めてみます。
# 2018 Q3(5)  2024.10.17

from scipy.optimize import fsolve

# パラメータ設定
n = 8  # 試行回数
observed_mean = 3.5  # 仮定した標本平均

# モーメント法の方程式
def moment_eq(theta, observed_mean, n):
    return observed_mean - (n * theta) / (1 - (1 - theta)**n)

# 数値的に方程式を解く
theta_hat = fsolve(moment_eq, 0.1, args=(observed_mean, n))[0]

# 結果を表示
print(f"θ ハット: {theta_hat}")
θ ハット: 0.4328142334547646求まりました。
次に反復計算で解いてみます。
# 2018 Q3(5)  2024.10.17

import numpy as np

# パラメータ設定
n = 8  # 試行回数
observed_mean = 3.5  # 仮定された標本平均
max_iterations = 100  # 最大反復回数
tolerance = 1e-6  # 収束判定の閾値

# 初期推定値
theta_hat = observed_mean / n

# 反復計算
for iteration in range(max_iterations):
    new_theta_hat = (observed_mean / n) * (1 - (1 - theta_hat) ** n)

    # 収束判定
    if abs(new_theta_hat - theta_hat) < tolerance:
        break

    theta_hat = new_theta_hat

# 結果の表示
print(f"θ ハット: {theta_hat}")
θ ハット: 0.432814320144486同じ値になりました。
次は単純にθを0.01から0.99まで変化させて![]() が1になるθを見つけます。
が1になるθを見つけます。
# 2018 Q3(5)  2024.10.17

import numpy as np
import matplotlib.pyplot as plt

# パラメータ設定
n = 8  # 試行回数
observed_mean = 3.5  # 仮定した標本平均
theta_values = np.linspace(0.01, 0.99, 100)  # θを0.01から0.99まで100点で変化させる

# f(θ) の定義
def f_theta(theta, n, observed_mean):
    return (n * theta) / (observed_mean * (1 - (1 - theta) ** n))

# f(θ) を計算
f_values = f_theta(theta_values, n, observed_mean)

# f(θ) = 1 となる交点を見つける
intersection_index = np.argmin(np.abs(f_values - 1))
theta_hat = theta_values[intersection_index]

# 交点の θ ハットの値を表示
print(f"θ ハット: {theta_hat}")

# グラフの描画
plt.plot(theta_values, f_values, label='f(θ)', color='blue')
plt.axhline(y=1, color='red', linestyle='--', label='y = 1')
plt.xlabel("θ", fontsize=12)
plt.ylabel("f(θ)", fontsize=12)
plt.title("f(θ) のグラフ (左辺 / 右辺の比)", fontsize=14)
plt.legend()
plt.grid(True)

# グラフの表示
plt.show()
θ ハット: 0.43565656565656563
概ね同じ値になりました。