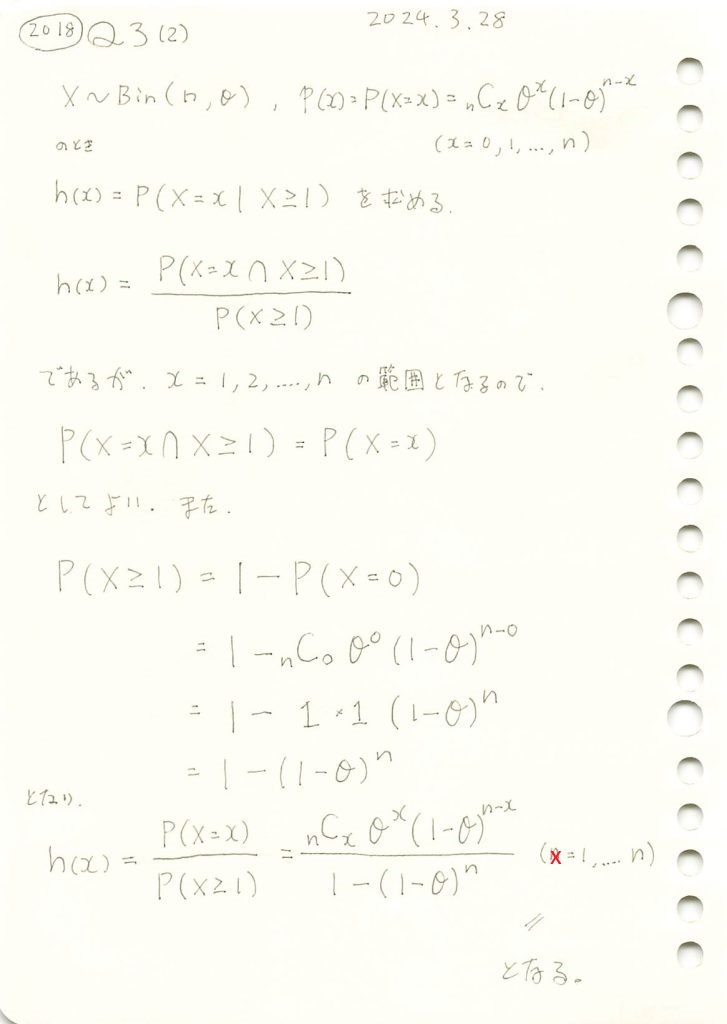
二項分布の条件付き確率質量関数を求めました。
コード
条件付き二項分布のシミュレーションを行い理論値と一致するか確認します。
# 2018 Q3(2)  2024.10.12

import numpy as np
import matplotlib.pyplot as plt

# パラメータ設定
n = 10  # 試行回数
theta = 0.5  # 成功確率
num_simulations = 10000  # シミュレーション回数

# 二項分布に従うランダム変数を生成
binom_samples = np.random.binomial(n, theta, num_simulations)

# X >= 1 の条件を満たすサンプルを抽出
samples_X_geq_1 = binom_samples[binom_samples >= 1]

# X = x の回数を数える
counts, _ = np.histogram(samples_X_geq_1, bins=np.arange(n+2))

# シミュレーションによる条件付き確率(X = 1 から n の範囲で計算)
simulated_probabilities = counts[1:] / np.sum(counts)

# 理論上の条件付き確率 h(x)
x_values = np.arange(1, n+1)
binom_pmf = np.array([np.math.comb(n, x) * theta**x * (1-theta)**(n-x) for x in x_values])
theoretical_probabilities = binom_pmf / (1 - (1 - theta)**n)

# シミュレーション結果をヒストグラムで表示
plt.bar(x_values, simulated_probabilities, color='blue', alpha=0.6, label="シミュレーション")
plt.plot(x_values, theoretical_probabilities, label="理論値", marker='x', linestyle='-', color='red')

# グラフの描画
plt.xlabel("X の値", fontsize=12)
plt.ylabel("条件付き確率 P(X = x | X >= 1)", fontsize=12)
plt.title(f"条件付き確率のシミュレーションと理論値の比較 (n={n}, θ={theta})", fontsize=14)
plt.legend()
plt.grid(True)
plt.show()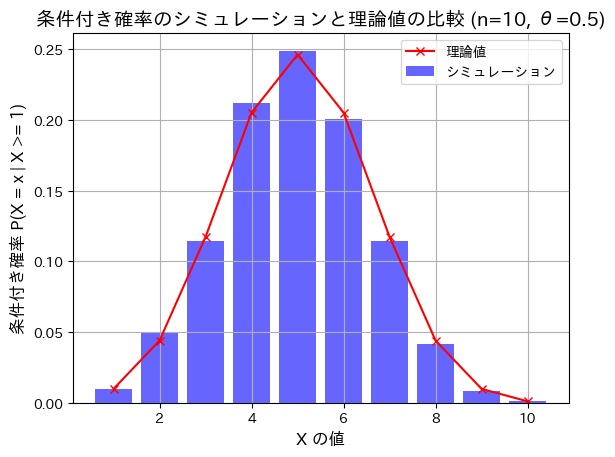
シミュレーションによる結果と理論値が一致しました。