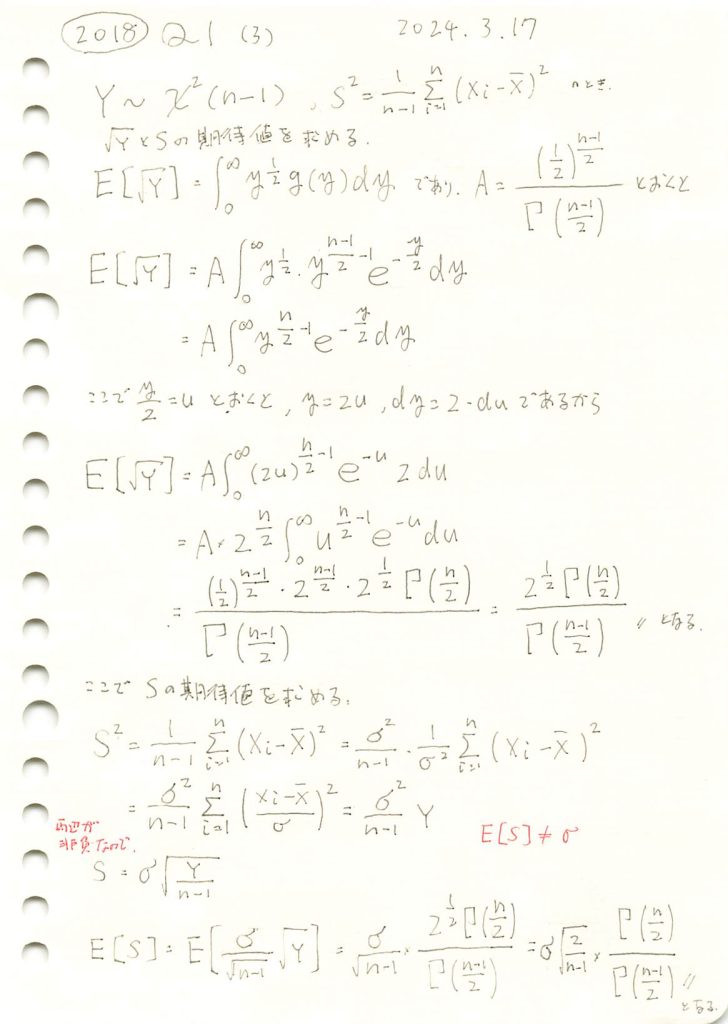
カイ二乗分布の平方根の期待値と標本標準偏差の期待値を求めました。不偏分散の期待値は母分散なのにその平方根の期待値は母標準偏差にはならないのが面白い。

コード
数式を使って期待値E[√Y]とE[S]を求めます。
# 2018 Q1(3)  2024.10.3

import sympy as sp

# 変数の定義
y, n, sigma = sp.symbols('y n sigma', positive=True)
k = n - 1  # 自由度

# カイ二乗分布の確率密度関数 g(y)
g_y = (1/2)**(k/2) * y**(k/2 - 1) * sp.exp(-y/2) / sp.gamma(k/2)

# 平方根の期待値 E[√Y] の積分を計算
E_sqrt_Y = sp.integrate(sp.sqrt(y) * g_y, (y, 0, sp.oo))

# 標本標準偏差 S の期待値 E[S] を計算
E_S = sigma * E_sqrt_Y / sp.sqrt(n-1)

# 結果の表示
display(E_sqrt_Y.simplify())  # E[√Y] の表示
display(E_S.simplify())       # E[S] の表示
余分な1.0^nが含まれますが手計算と一致しました。
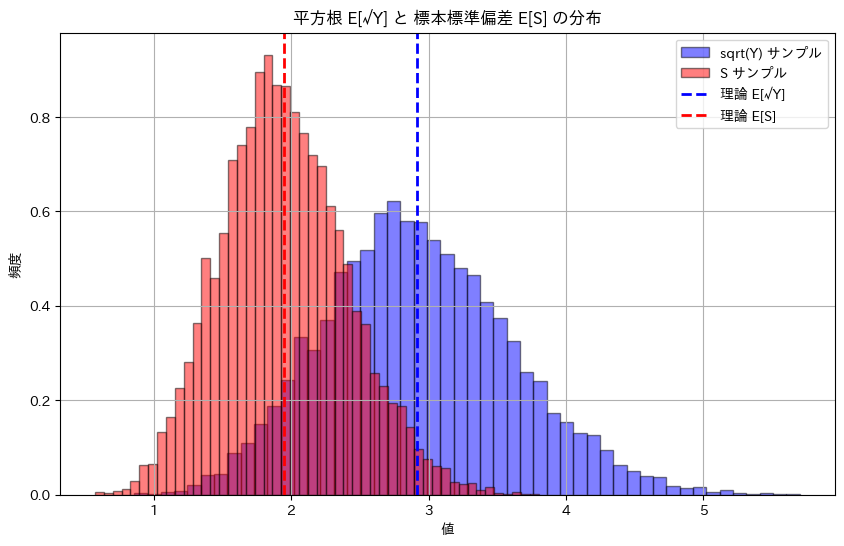
次に、期待値E[√Y]とE[S]を数値シミュレーションで求めてみます。
# 2018 Q1(3)  2024.10.3

import numpy as np
import matplotlib.pyplot as plt
from scipy.special import gamma

# パラメータ設定
n = 10  # サンプルサイズ (自由度は n-1)
degrees_of_freedom = n - 1  # 自由度
sigma = 2  # 母標準偏差
num_simulations = 10000  # シミュレーションの回数

# カイ二乗分布に従う乱数を生成
chi_squared_samples = np.random.chisquare(df=degrees_of_freedom, size=num_simulations)

# 平方根 E[√Y] のシミュレーション
sqrt_Y_simulation = np.mean(np.sqrt(chi_squared_samples))

# 標本標準偏差 S のシミュレーション
S_simulation = np.mean(sigma * np.sqrt(chi_squared_samples / (n - 1)))

# 理論値 E[√Y] と E[S] の計算
E_sqrt_Y_theoretical = np.sqrt(2) * gamma(n / 2) / gamma((n - 1) / 2)
E_S_theoretical = sigma * np.sqrt(2 / (n - 1)) * gamma(n / 2) / gamma((n - 1) / 2)

# 結果表示
print(f"平方根 E[√Y] の理論値: {E_sqrt_Y_theoretical:.4f}")
print(f"平方根 E[√Y] のシミュレーション結果: {sqrt_Y_simulation:.4f}")
print(f"標本標準偏差 E[S] の理論値: {E_S_theoretical:.4f}")
print(f"標本標準偏差 E[S] のシミュレーション結果: {S_simulation:.4f}")

# ヒストグラムの描画
plt.figure(figsize=(10, 6))

# 平方根 E[√Y] のヒストグラム
plt.hist(np.sqrt(chi_squared_samples), bins=50, alpha=0.5, color='b', edgecolor='black', label='sqrt(Y) サンプル', density=True)

# 標本標準偏差 E[S] のヒストグラム
plt.hist(sigma * np.sqrt(chi_squared_samples / (n - 1)), bins=50, alpha=0.5, color='r', edgecolor='black', label='S サンプル', density=True)

# 平方根 E[√Y] の理論値の線
plt.axvline(E_sqrt_Y_theoretical, color='blue', linestyle='dashed', linewidth=2, label='理論 E[√Y]')

# 標本標準偏差 E[S] の理論値の線
plt.axvline(E_S_theoretical, color='red', linestyle='dashed', linewidth=2, label='理論 E[S]')

# グラフの設定
plt.title('平方根 E[√Y] と 標本標準偏差 E[S] の分布')
plt.xlabel('値')
plt.ylabel('頻度')
plt.legend()
plt.grid(True)
plt.show()
平方根 E[√Y] の理論値: 2.9180
平方根 E[√Y] のシミュレーション結果: 2.9222
標本標準偏差 E[S] の理論値: 1.9453
標本標準偏差 E[S] のシミュレーション結果: 1.9481
シミュレーションによる期待値E[√Y]とE[S]は理論値に近い値をとりました。E[S^2]=σ^2であっても面白いことにE[S]=σにはならない。上の例ではσ=2ですがシミュレーションと一致しません。標本標準偏差 Sは母標準偏差 σの不偏推定量ではないためです。