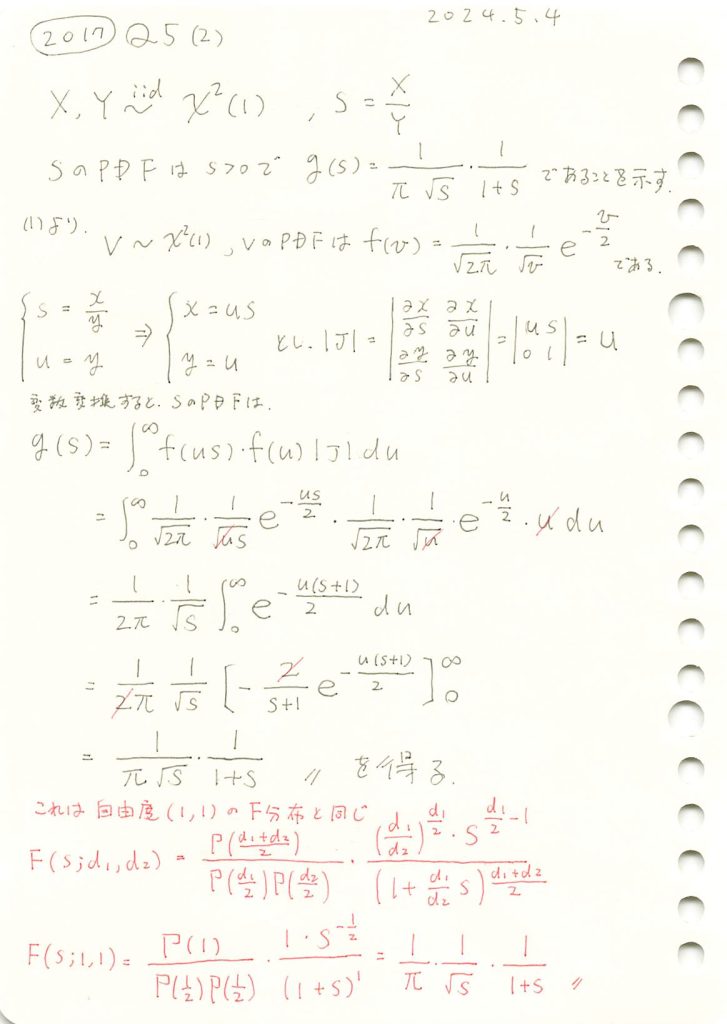
独立した二つの自由度1のカイ二乗分布の比の確率密度関数を導出し、F(1,1)分布と同じであることを確認しました。

コード
Sについてシミュレーションし、確率密度関数![]() と一致するか確認をします。
と一致するか確認をします。
# 2017 Q5(2)  2024.11.9

import numpy as np
import matplotlib.pyplot as plt

# サンプルサイズ
n_samples = 100000

# 自由度1のカイ二乗分布からサンプルを生成
X = np.random.chisquare(df=1, size=n_samples)
Y = np.random.chisquare(df=1, size=n_samples)

# 確率変数 S = X / Y の計算
S = X / Y

# 理論的な確率密度関数 g(s) の定義
def theoretical_g(s):
    return (1 / (np.pi * np.sqrt(s) * (1 + s)))

# x 軸の範囲を設定し、g(s) を計算
x = np.linspace(0.01, 10, 100)  # 0.01から10の範囲に制限
g_s = theoretical_g(x)

# ヒストグラムの描画
plt.hist(S, bins=200, density=True, alpha=0.5, range=(0, 10), label='シミュレーションによる $S=X/Y$')
plt.plot(x, g_s, 'r-', label='理論的な $g(s) = \\frac{1}{\\pi \\sqrt{s}} \\cdot \\frac{1}{1+s}$')
plt.xlabel('$S$')
plt.ylabel('密度')
plt.legend()
plt.title('確率変数 $S=X/Y$ のシミュレーションと理論密度関数')
plt.show()
Sの分布は確率密度関数![]() と一致することが確認できました。
と一致することが確認できました。