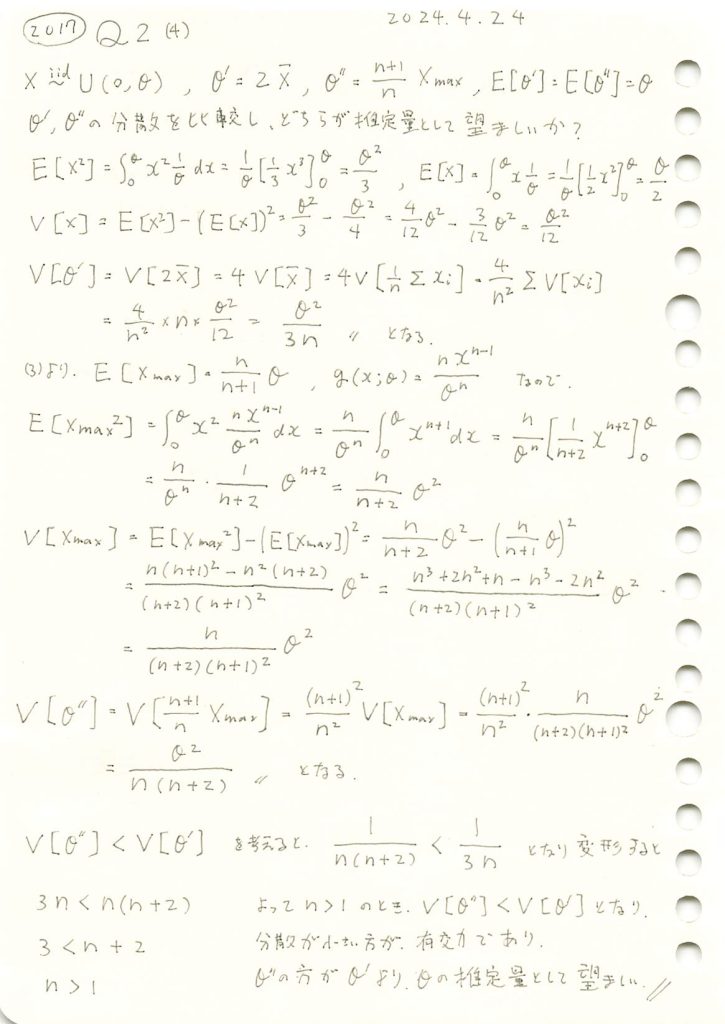
二つの不偏推定量の分散の大きさを比較する事でどちらの推定量が望ましいかを調べました。

コード
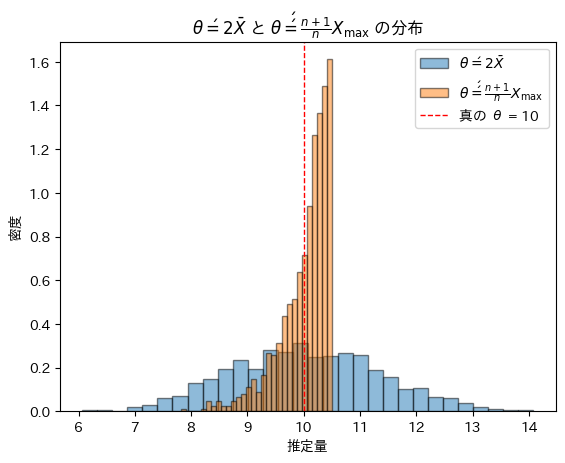
θ=10,n=20としてシミュレーションを行い、θ’とθ’’の分布を重ねて描画してみます。
# 2017 Q2(4)  2024.11.1

import numpy as np
import matplotlib.pyplot as plt

# パラメータ設定
theta_true = 10  # 真の θ の値
n = 20           # サンプルサイズ
num_trials = 1000  # シミュレーションの試行回数

# θ' = 2 * X̄ と θ'' = (n + 1) / n * X_max の推定値を記録するリスト
theta_prime_estimates = []
theta_double_prime_estimates = []

# シミュレーションを実行
for _ in range(num_trials):
    # 一様分布 U(0, theta_true) から n 個のサンプルを生成
    samples = np.random.uniform(0, theta_true, n)

    # θ' = 2 * X̄ を計算
    theta_prime = 2 * np.mean(samples)
    theta_prime_estimates.append(theta_prime)

    # θ'' = (n + 1) / n * X_max を計算
    theta_double_prime = (n + 1) / n * np.max(samples)
    theta_double_prime_estimates.append(theta_double_prime)

# ヒストグラムの表示
plt.hist(theta_prime_estimates, bins=30, edgecolor='black', density=True, alpha=0.5, label=r'$\theta\' = 2 \bar{X}$')
plt.hist(theta_double_prime_estimates, bins=30, edgecolor='black', density=True, alpha=0.5, label=r'$\theta\'\' = \frac{n + 1}{n} X_{\max}$')
plt.axvline(theta_true, color='red', linestyle='dashed', linewidth=1, label=f"真の θ = {theta_true}")
plt.xlabel('推定量')
plt.ylabel('密度')
plt.title(r'$\theta\' = 2 \bar{X}$ と $\theta\'\' = \frac{n + 1}{n} X_{\max}$ の分布')
plt.legend()
plt.show()

θ’とθ’’は同じ期待(θ)を持つものの横の広がり方が異なりθ’’の分散はθ’の分散よりも小さいことが確認できました。
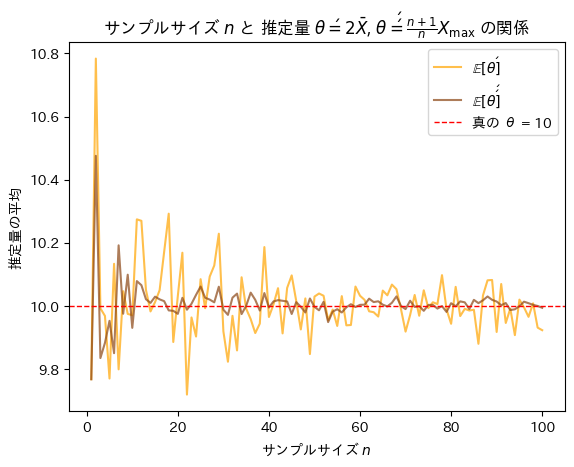
次にサンプルサイズnを変化させて不偏推定量θ’とθ’’を重ねて描画してみます。
# 2017 Q2(4)  2024.11.1

import numpy as np
import matplotlib.pyplot as plt

# パラメータ設定
theta_true = 10  # 真の θ の値
max_n = 100      # 最大サンプルサイズ
num_trials_per_n = 100  # 各サンプルサイズでの試行回数

# 各サンプルサイズにおける θ' と θ'' の平均を記録
theta_prime_means = []
theta_double_prime_means = []

# サンプルサイズ n を 1 から max_n まで増やしながらシミュレーション
for n in range(1, max_n + 1):
    theta_prime_estimates = []
    theta_double_prime_estimates = []

    for _ in range(num_trials_per_n):
        # 一様分布 U(0, theta_true) から n 個のサンプルを生成
        samples = np.random.uniform(0, theta_true, n)

        # θ' = 2 * X̄ を計算し、その推定値を記録
        theta_prime = 2 * np.mean(samples)
        theta_prime_estimates.append(theta_prime)

        # θ'' = (n + 1) / n * X_max を計算し、その推定値を記録
        theta_double_prime = (n + 1) / n * np.max(samples)
        theta_double_prime_estimates.append(theta_double_prime)

    # 各 n に対する θ' と θ'' の平均を保存
    theta_prime_means.append(np.mean(theta_prime_estimates))
    theta_double_prime_means.append(np.mean(theta_double_prime_estimates))

# グラフ描画
plt.plot(range(1, max_n + 1), theta_prime_means, label=r'$\mathbb{E}[\theta\']$', color='orange', alpha=0.7)
plt.plot(range(1, max_n + 1), theta_double_prime_means, label=r'$\mathbb{E}[\theta\'\']$', color='saddlebrown', alpha=0.7)
plt.axhline(theta_true, color='red', linestyle='dashed', linewidth=1, label=f"真の θ = {theta_true}")
plt.xlabel(r'サンプルサイズ $n$')
plt.ylabel('推定量の平均')
plt.title(r'サンプルサイズ $n$ と 推定量 $\theta\' = 2 \bar{X}$, $\theta\'\' = \frac{n + 1}{n} X_{\max}$ の関係')
plt.legend()
plt.show()
サンプルサイズnが増加するにつれて不偏推定量θ’とθ’’は共に真のθに近づくものの振幅が異なりθ’’の分散はθ’の分散よりも小さいことが確認できました。また収束する速度もθ’’はθ’よりも速いことが確認できました。