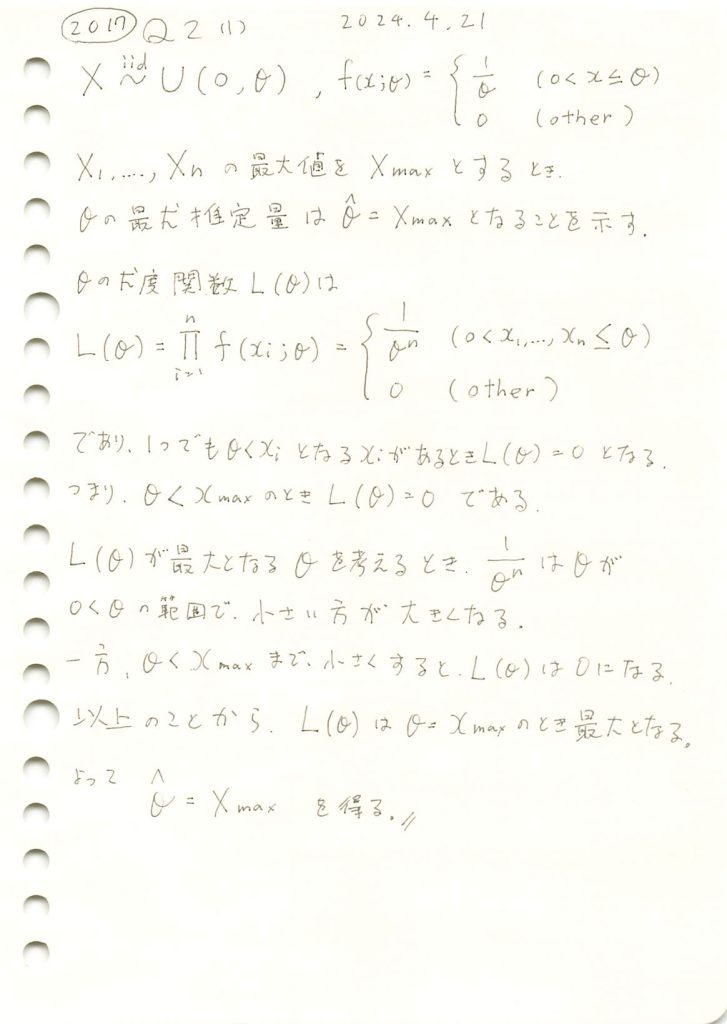
一様分布の上限の最尤推定量を求めました。

コード
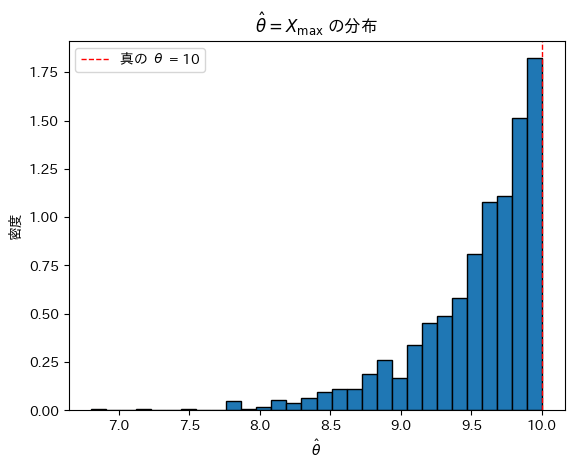
θ=10,n=20としてシミュレーションを行い、![]() の分布を見てみます。
の分布を見てみます。
# 2017 Q2(1)  2024.10.29

import numpy as np
import matplotlib.pyplot as plt

# シミュレーションのパラメータ
theta_true = 10  # 真の θ の値
n = 20           # 1試行あたりのサンプル数
num_trials = 1000  # シミュレーションの試行回数

# シミュレーションを実行
theta_estimates = []
for _ in range(num_trials):
    # 一様分布 U(0, theta_true) から n 個のサンプルを生成
    samples = np.random.uniform(0, theta_true, n)
    # サンプルの最大値を推定値 θ_hat として記録
    theta_hat = np.max(samples)
    theta_estimates.append(theta_hat)

# 推定値の分布をヒストグラムで表示
plt.hist(theta_estimates, bins=30, edgecolor='black', density=True)
plt.axvline(theta_true, color='red', linestyle='dashed', linewidth=1, label=f"真の θ = {theta_true}")
plt.xlabel(r'$\hat{\theta}$')
plt.ylabel('密度')
plt.title(r'$\hat{\theta} = X_{\max}$ の分布')
plt.legend()
plt.show()
![]() は真のθより大きくならないため、結果としてθよりやや小さな値を取っているように見えます。
は真のθより大きくならないため、結果としてθよりやや小さな値を取っているように見えます。
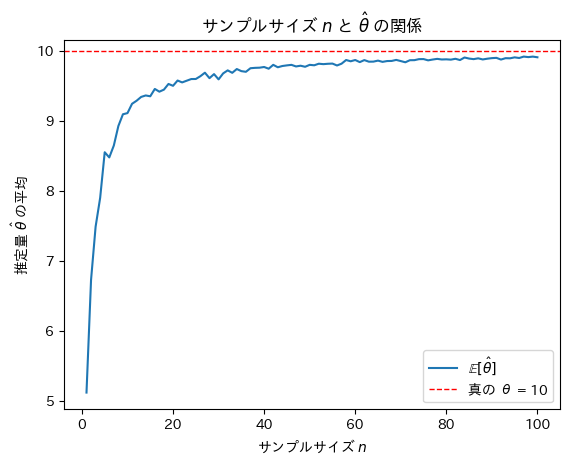
次にサンプルサイズnを変化させて最尤推定量![]() がどうなるのか確認をします。
がどうなるのか確認をします。
# 2017 Q2(1)  2024.10.29

import numpy as np
import matplotlib.pyplot as plt

# パラメータ設定
theta_true = 10  # 真の θ の値
max_n = 100  # 最大サンプルサイズ
num_trials_per_n = 100  # 各サンプルサイズでの試行回数

# 各サンプルサイズにおける θ^ の平均を記録
theta_hat_means = []

# サンプルサイズ n を 1 から max_n まで増やしながらシミュレーション
for n in range(1, max_n + 1):
    theta_estimates = []
    for _ in range(num_trials_per_n):
        # 一様分布 U(0, theta_true) から n 個のサンプルを生成
        samples = np.random.uniform(0, theta_true, n)
        # サンプルの最大値を推定値 θ_hat として記録
        theta_hat = np.max(samples)
        theta_estimates.append(theta_hat)
    # 各 n に対する θ^ の平均を保存
    theta_hat_means.append(np.mean(theta_estimates))

# グラフ描画
plt.plot(range(1, max_n + 1), theta_hat_means, label=r'$\mathbb{E}[\hat{\theta}]$')
plt.axhline(theta_true, color='red', linestyle='dashed', linewidth=1, label=f"真の θ = {theta_true}")
plt.xlabel(r'サンプルサイズ $n$')
plt.ylabel(r'推定量 $\hat{\theta}$ の平均')
plt.title(r'サンプルサイズ $n$ と $\hat{\theta}$ の関係')
plt.legend()
plt.show()
サンプルサイズnが増加するにつれて最尤推定量![]() は真のθに近づくことが確認できました。
は真のθに近づくことが確認できました。