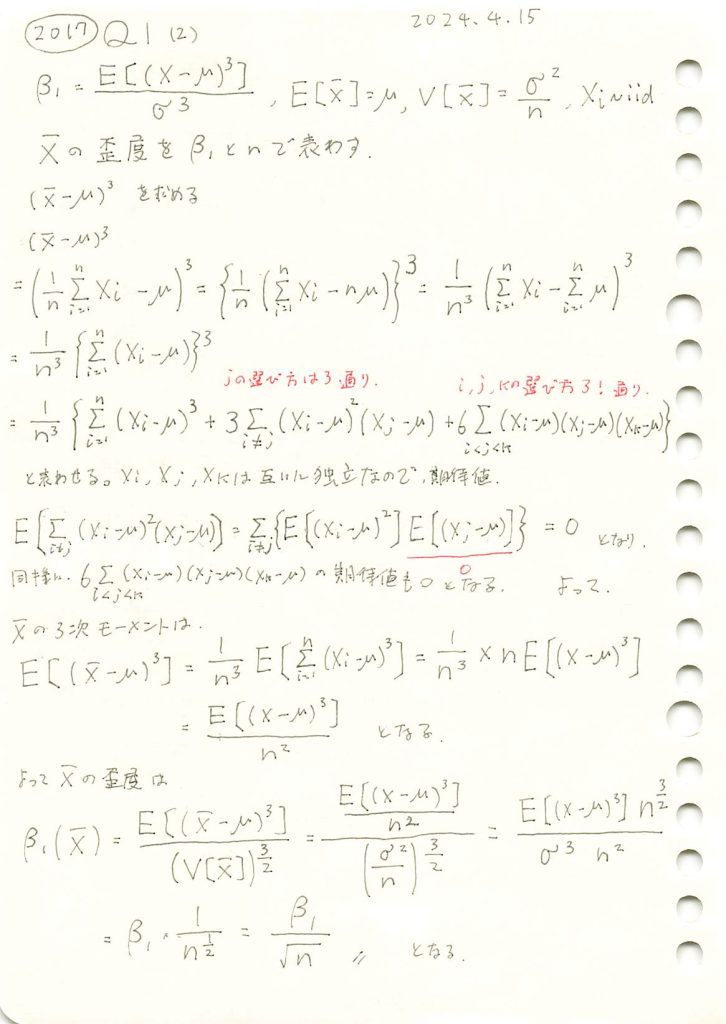
標本平均の歪度を求めました。

コード
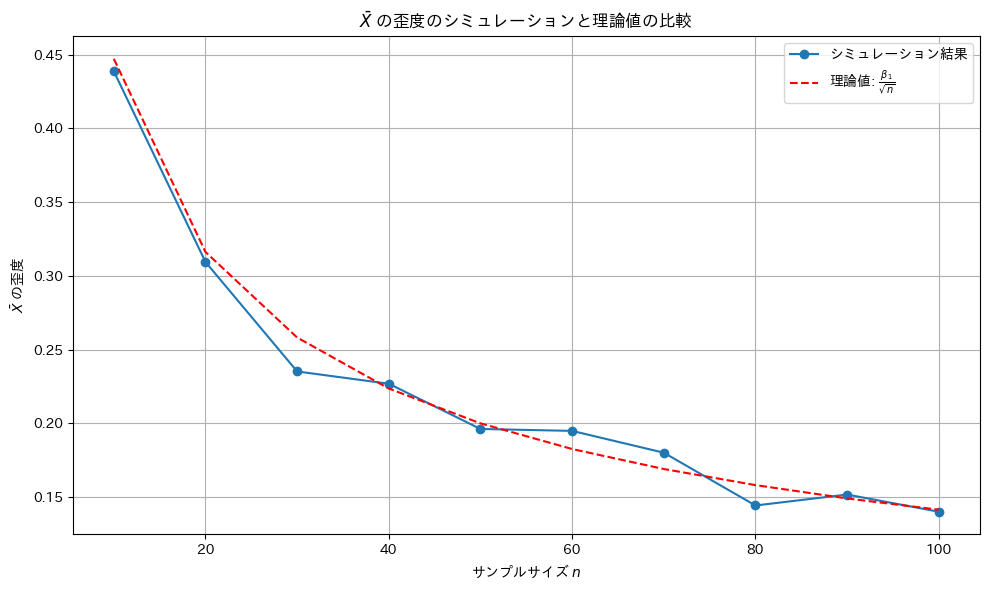
Xの標本平均の歪度が![]() になるか確認するためにシミュレーションを行います。母集団分布はガンマ分布とします。
になるか確認するためにシミュレーションを行います。母集団分布はガンマ分布とします。
from scipy.stats import skew, gamma
import numpy as np
import matplotlib.pyplot as plt

# シミュレーションパラメータの設定
num_simulations = 30000  # シミュレーションの繰り返し回数
sample_sizes = range(10, 110, 10)  # サンプルサイズの設定

# 歪度を持つ母集団分布としてガンマ分布を使用(shape=2で正の歪度を持つ)
shape_param = 2.0  # ガンマ分布のshapeパラメータ
scale_param = 2.0  # ガンマ分布のscaleパラメータ
population_dist = gamma(a=shape_param, scale=scale_param)

# 理論的な歪度(ガンマ分布の歪度の計算)
beta_1_theoretical = 2 / np.sqrt(shape_param)  # ガンマ分布の理論的な歪度

# シミュレーション結果を保存するリスト
sample_mean_skewness = []

# 各サンプルサイズでのシミュレーションの実行
for n in sample_sizes:
    skew_values = []

    # シミュレーションを繰り返し
    for _ in range(num_simulations):
        sample = population_dist.rvs(size=n)  # サンプルを抽出
        sample_mean = np.mean(sample)  # 標本平均
        skew_values.append(sample_mean)

    # 標本平均の歪度を計算
    skewness_of_sample_mean = skew(skew_values)
    sample_mean_skewness.append(skewness_of_sample_mean)

# 理論値の計算
theoretical_skewness = [beta_1_theoretical / np.sqrt(n) for n in sample_sizes]

# グラフの作成
plt.figure(figsize=(10, 6))

# シミュレーション結果のプロット
plt.plot(sample_sizes, sample_mean_skewness, marker='o', label='シミュレーション結果')
plt.plot(sample_sizes, theoretical_skewness, color='r', linestyle='--', label='理論値: $\\frac{\\beta_1}{\sqrt{n}}$')

plt.title('$\\bar{X}$ の歪度のシミュレーションと理論値の比較')
plt.xlabel('サンプルサイズ $n$')
plt.ylabel('$\\bar{X}$ の歪度')
plt.legend()
plt.grid(True)

# グラフの表示
plt.tight_layout()
plt.show()
歪度は外れ値の影響を受けやすいものの概ね理論値と一致しました。