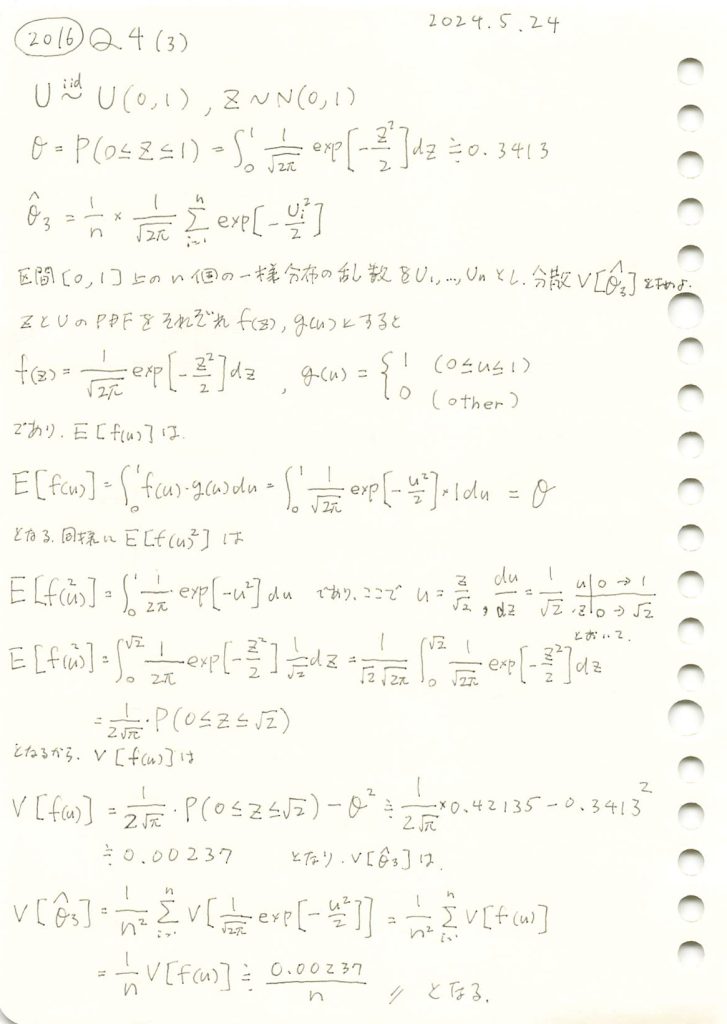
一様分布に従う確率変数を標準正規分布の確率密度関数に与え、その標本平均の分散を求めました。

コード
θの三つの推定量![]() ,
,![]() ,
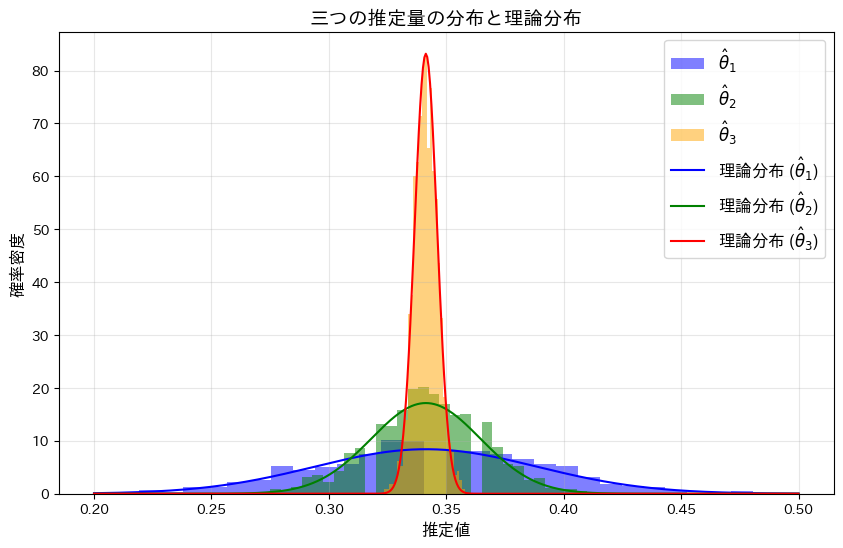
,![]() についてシミュレーションを行い、それぞれの分布を確認します。(
についてシミュレーションを行い、それぞれの分布を確認します。(![]() ,
,![]() については前問参照https://statistics.blue/2016-q41/,https://statistics.blue/2016-q42/)
については前問参照https://statistics.blue/2016-q41/,https://statistics.blue/2016-q42/)
# 2016 Q4(3)  2024.11.25

import numpy as np
import matplotlib.pyplot as plt
from scipy.stats import norm

# パラメータの設定
n = 100  # サンプルサイズ
n_trials = 1000  # シミュレーション試行回数
theta = 0.3413  # 真の成功確率

# 推定量 1: θ̂1 = X / n
theta_hat_1_values = []
for _ in range(n_trials):
    samples = np.random.normal(0, 1, n)
    X = np.sum((samples >= 0) & (samples <= 1))  # 0 <= Z <= 1 のカウント
    theta_hat_1_values.append(X / n)

# 推定量 2: θ̂2 = Y / (2n)
theta_hat_2_values = []
for _ in range(n_trials):
    samples = np.random.normal(0, 1, n)
    Y = np.sum(np.abs(samples) <= 1)  # |Z| <= 1 のカウント
    theta_hat_2_values.append(Y / (2 * n))

# 推定量 3: θ̂3 = 平均
theta_hat_3_values = []
for _ in range(n_trials):
    U = np.random.uniform(0, 1, n)  # 一様分布 [0, 1]
    theta_hat_3 = np.mean((1 / np.sqrt(2 * np.pi)) * np.exp(-U**2 / 2))
    theta_hat_3_values.append(theta_hat_3)

# ヒストグラムのプロット
plt.figure(figsize=(10, 6))

# ヒストグラム: θ̂1
plt.hist(theta_hat_1_values, bins=30, density=True, alpha=0.5, label='$\\hat{\\theta}_1$', color='blue')

# ヒストグラム: θ̂2
plt.hist(theta_hat_2_values, bins=30, density=True, alpha=0.5, label='$\\hat{\\theta}_2$', color='green')

# ヒストグラム: θ̂3
plt.hist(theta_hat_3_values, bins=30, density=True, alpha=0.5, label='$\\hat{\\theta}_3$', color='orange')

# 理論分布 (正規分布) の線を重ねる
x = np.linspace(0.2, 0.5, 500)
std_theta_hat_1 = np.sqrt(theta * (1 - theta) / n)
std_theta_hat_2 = np.sqrt(2 * theta * (1 - 2 * theta) / (4 * n))
std_theta_hat_3 = np.sqrt(0.0023 / n)

plt.plot(x, norm.pdf(x, loc=theta, scale=std_theta_hat_1), 'b-', label='理論分布 ($\\hat{\\theta}_1$)')
plt.plot(x, norm.pdf(x, loc=theta, scale=std_theta_hat_2), 'g-', label='理論分布 ($\\hat{\\theta}_2$)')
plt.plot(x, norm.pdf(x, loc=theta, scale=std_theta_hat_3), 'r-', label='理論分布 ($\\hat{\\theta}_3$)')

# プロットの設定
plt.title('三つの推定量の分布と理論分布', fontsize=14)
plt.xlabel('推定値', fontsize=12)
plt.ylabel('確率密度', fontsize=12)
plt.legend(fontsize=12)
plt.grid(alpha=0.3)

# グラフの表示
plt.show()
![]() <
<![]() <
<![]() の順にバラつきが小さくなり、分散が最も小さい
の順にバラつきが小さくなり、分散が最も小さい![]() がこの中で最も優れた推定量であることが分かりました。
がこの中で最も優れた推定量であることが分かりました。