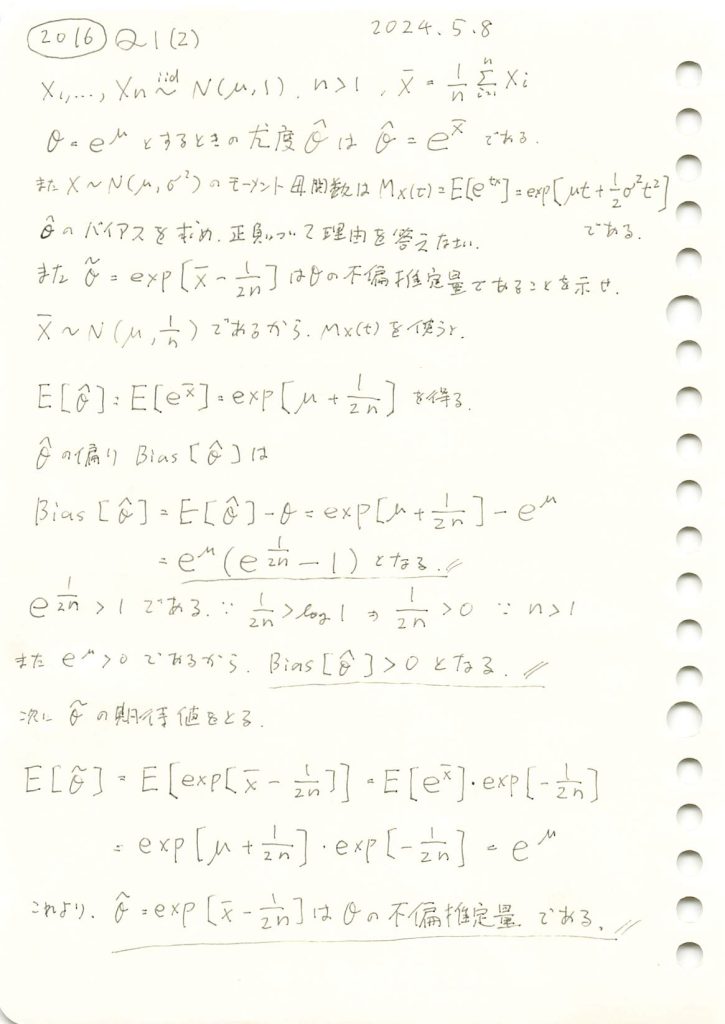
正規分布の母平均μに対してθ=exp(μ)をパラメータとする最尤推定量のバイアスを調べて、与式がθの不偏推定量であることを示しました。

コード
![]() と
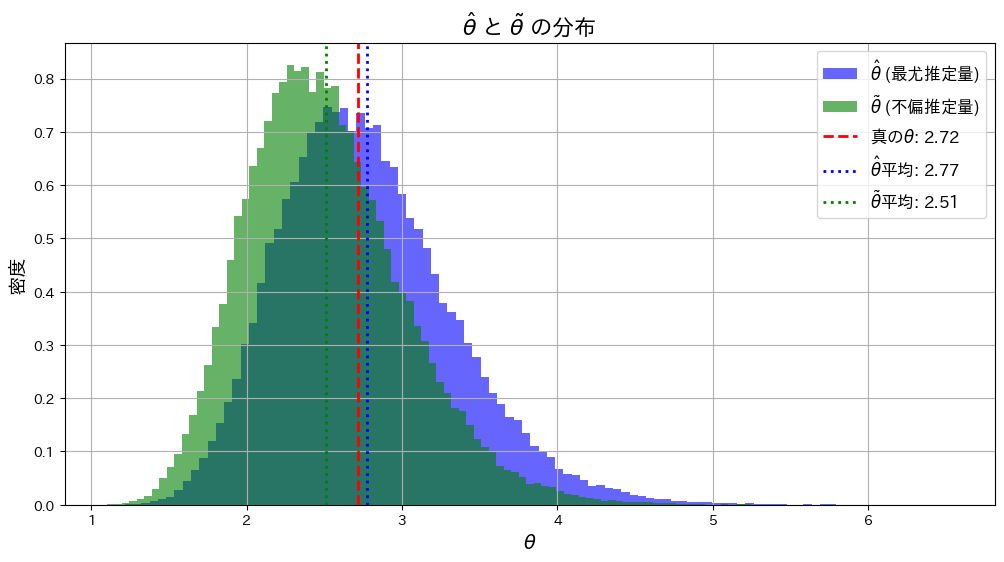
と![]() が真のθに近づくか確認するため、シミュレーションを行います。まずはサンプルサイズn=5で試してみます。
が真のθに近づくか確認するため、シミュレーションを行います。まずはサンプルサイズn=5で試してみます。
# 2016 Q1(2)  2024.11.12

import numpy as np
import matplotlib.pyplot as plt

# シミュレーションのパラメータ
mu_true = 1.0  # 真の平均 (mu)
theta_true = np.exp(mu_true)  # 真の θ = e^mu
n_samples = 5  # サンプルサイズ
n_trials = 100000  # シミュレーション試行回数

# 乱数生成と推定量の計算
theta_hat_estimates = []
theta_tilde_estimates = []

for _ in range(n_trials):
    sample = np.random.normal(loc=mu_true, scale=1/np.sqrt(n_samples), size=n_samples)
    X_bar = np.mean(sample)  # 標本平均

    # 最尤推定量 θ^
    theta_hat = np.exp(X_bar)
    theta_hat_estimates.append(theta_hat)

    # 不偏推定量 θ~
    theta_tilde = np.exp(X_bar - 1/(2*n_samples))
    theta_tilde_estimates.append(theta_tilde)

# 推定量の平均を計算
theta_hat_mean = np.mean(theta_hat_estimates)
theta_tilde_mean = np.mean(theta_tilde_estimates)

# グラフ描画
plt.figure(figsize=(12, 6))

# ヒストグラムの描画
plt.hist(theta_hat_estimates, bins=100, density=True, alpha=0.6, color='blue', label='$\\hat{\\theta}$ (最尤推定量)')
plt.hist(theta_tilde_estimates, bins=100, density=True, alpha=0.6, color='green', label='$\\tilde{\\theta}$ (不偏推定量)')

# 真の値を赤線で表示
plt.axvline(theta_true, color='red', linestyle='dashed', linewidth=2, label=f'真の$\\theta$: {theta_true:.2f}')

# θハットとθチルダの平均をそれぞれ緑線と青線で表示
plt.axvline(theta_hat_mean, color='blue', linestyle='dotted', linewidth=2, label=f'$\\hat{{\\theta}}$平均: {theta_hat_mean:.2f}')
plt.axvline(theta_tilde_mean, color='green', linestyle='dotted', linewidth=2, label=f'$\\tilde{{\\theta}}$平均: {theta_tilde_mean:.2f}')

# グラフのタイトルとラベル
plt.title('$\\hat{\\theta}$ と $\\tilde{\\theta}$ の分布', fontsize=16)
plt.xlabel('$\\theta$', fontsize=14)
plt.ylabel('密度', fontsize=14)
plt.legend(fontsize=12)
plt.grid(True)
plt.show()
![]() は
は![]() よりも真のθに近くなっています。これはサンプルサイズnが小さいことと、および推定量の分散の違いが起因しているのかもしれません。
よりも真のθに近くなっています。これはサンプルサイズnが小さいことと、および推定量の分散の違いが起因しているのかもしれません。
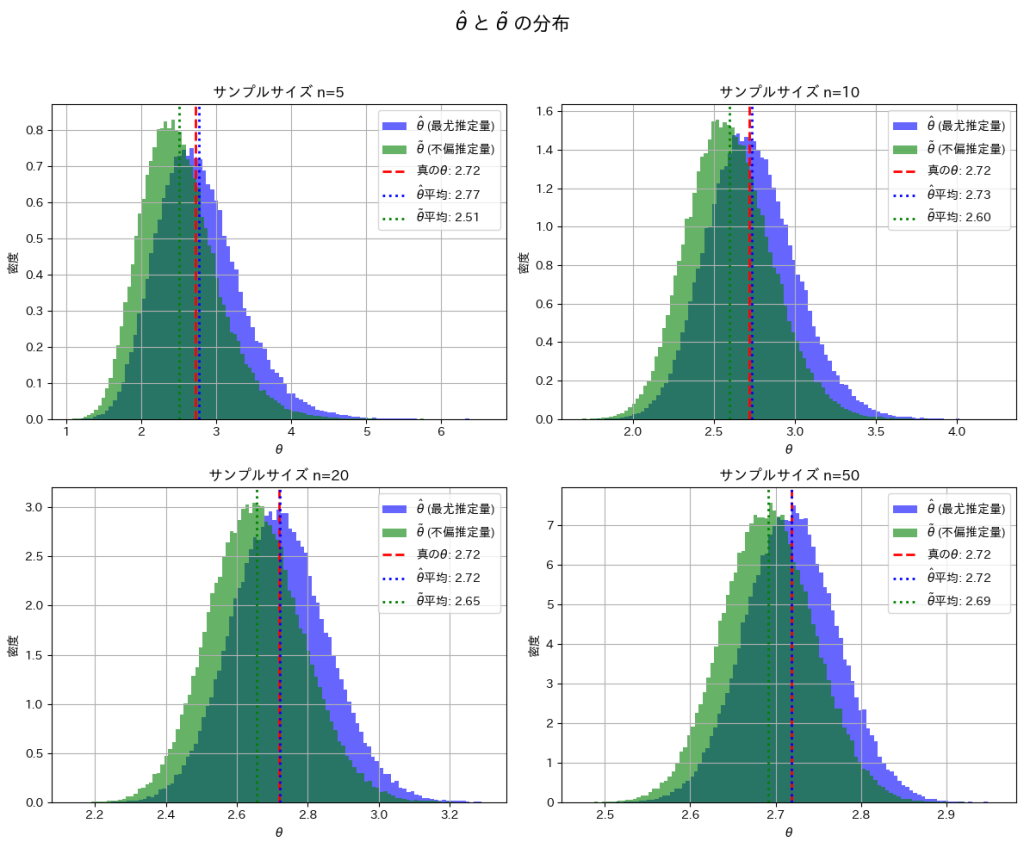
次に、サンプルサイズn=5, 10, 20, 50と変化させて、この乖離がどのように変わるかを確認します。
# 2016 Q1(2)  2024.11.12

import numpy as np
import matplotlib.pyplot as plt

# シミュレーションのパラメータ
mu_true = 1.0  # 真の平均 (mu)
theta_true = np.exp(mu_true)  # 真の theta = e^mu
n_trials = 100000  # シミュレーション試行回数
sample_sizes = [5, 10, 20, 50]  # サンプルサイズのリスト

fig, axes = plt.subplots(2, 2, figsize=(12, 10))
axes = axes.ravel()  # 2x2 の配列を平坦化

for i, n_samples in enumerate(sample_sizes):
    theta_hat_estimates = []
    theta_tilde_estimates = []

    for _ in range(n_trials):
        sample = np.random.normal(loc=mu_true, scale=1/np.sqrt(n_samples), size=n_samples)
        X_bar = np.mean(sample)

        # 最尤推定量
        theta_hat = np.exp(X_bar)
        theta_hat_estimates.append(theta_hat)

        # 不偏推定量
        theta_tilde = np.exp(X_bar - 1/(2*n_samples))
        theta_tilde_estimates.append(theta_tilde)

    theta_hat_mean = np.mean(theta_hat_estimates)
    theta_tilde_mean = np.mean(theta_tilde_estimates)

    # ヒストグラムのプロット
    axes[i].hist(theta_hat_estimates, bins=100, density=True, alpha=0.6, color='blue', label='$\\hat{\\theta}$ (最尤推定量)')
    axes[i].hist(theta_tilde_estimates, bins=100, density=True, alpha=0.6, color='green', label='$\\tilde{\\theta}$ (不偏推定量)')
    axes[i].axvline(theta_true, color='red', linestyle='dashed', linewidth=2, label=f'真の$\\theta$: {theta_true:.2f}')
    axes[i].axvline(theta_hat_mean, color='blue', linestyle='dotted', linewidth=2, label=f'$\\hat{{\\theta}}$平均: {theta_hat_mean:.2f}')
    axes[i].axvline(theta_tilde_mean, color='green', linestyle='dotted', linewidth=2, label=f'$\\tilde{{\\theta}}$平均: {theta_tilde_mean:.2f}')
    axes[i].set_title(f'サンプルサイズ n={n_samples}')
    axes[i].set_xlabel('$\\theta$')
    axes[i].set_ylabel('密度')
    axes[i].legend()
    axes[i].grid(True)

plt.suptitle('$\\hat{\\theta}$ と $\\tilde{\\theta}$ の分布', fontsize=16)
plt.tight_layout(rect=[0, 0, 1, 0.95])
plt.show()
nを大きくすることで、![]() と
と![]() は真のθの間の乖離が小さくなることを確認できました。
は真のθの間の乖離が小さくなることを確認できました。
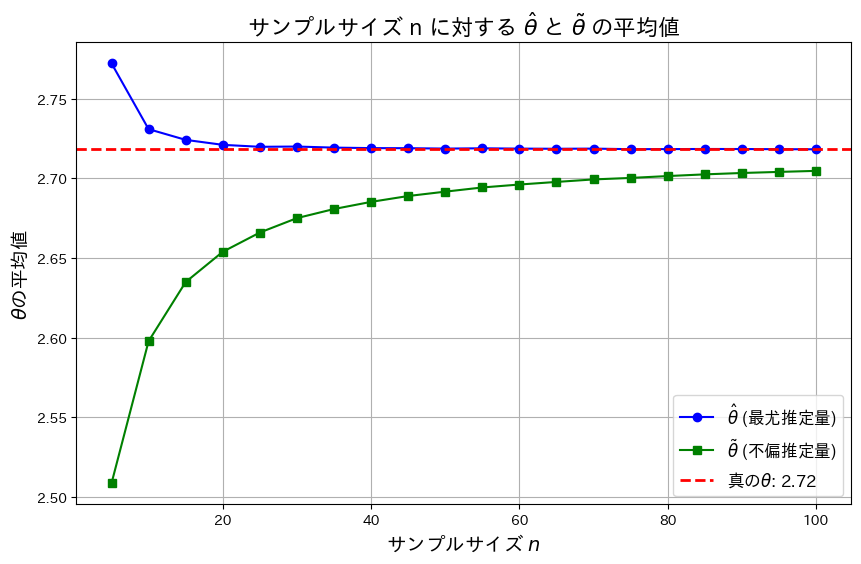
次に、nを変化させて![]() と
と![]() がどのように変化するか折れ線グラフで見てみます。
がどのように変化するか折れ線グラフで見てみます。
# 2016 Q1(2)  2024.11.12

import numpy as np
import matplotlib.pyplot as plt

# シミュレーションのパラメータ
mu_true = 1.0  # 真の平均 (mu)
theta_true = np.exp(mu_true)  # 真の theta = e^mu
n_trials = 100000  # シミュレーション試行回数
sample_sizes = np.arange(5, 101, 5)  # サンプルサイズ n の範囲 [5, 10, ..., 100]

# 推定量の平均値を格納するリスト
theta_hat_means = []
theta_tilde_means = []

# サンプルサイズを変化させてシミュレーション
for n_samples in sample_sizes:
    theta_hat_estimates = []
    theta_tilde_estimates = []

    for _ in range(n_trials):
        sample = np.random.normal(loc=mu_true, scale=1/np.sqrt(n_samples), size=n_samples)
        X_bar = np.mean(sample)

        # 最尤推定量
        theta_hat = np.exp(X_bar)
        theta_hat_estimates.append(theta_hat)

        # 不偏推定量
        theta_tilde = np.exp(X_bar - 1/(2*n_samples))
        theta_tilde_estimates.append(theta_tilde)

    # 平均値を格納
    theta_hat_means.append(np.mean(theta_hat_estimates))
    theta_tilde_means.append(np.mean(theta_tilde_estimates))

# 折れ線グラフの描画
plt.figure(figsize=(10, 6))
plt.plot(sample_sizes, theta_hat_means, marker='o', linestyle='-', color='blue', label='$\\hat{\\theta}$ (最尤推定量)')
plt.plot(sample_sizes, theta_tilde_means, marker='s', linestyle='-', color='green', label='$\\tilde{\\theta}$ (不偏推定量)')
plt.axhline(y=theta_true, color='red', linestyle='dashed', linewidth=2, label=f'真の$\\theta$: {theta_true:.2f}')

# ラベルとタイトル
plt.title('サンプルサイズ n に対する $\\hat{\\theta}$ と $\\tilde{\\theta}$ の平均値', fontsize=16)
plt.xlabel('サンプルサイズ $n$', fontsize=14)
plt.ylabel('$\\theta$の平均値', fontsize=14)
plt.legend(fontsize=12)
plt.grid(True)
plt.show()
![]() は真のθよりも大きい値を取り、徐々に減少し真のθに近づきます。一方
は真のθよりも大きい値を取り、徐々に減少し真のθに近づきます。一方![]() 真のθよりも小さい値を取り、徐々に増加し真のθに近づきます。また近づくスピードは
真のθよりも小さい値を取り、徐々に増加し真のθに近づきます。また近づくスピードは![]() のほうが早く、
のほうが早く、![]() の分散が
の分散が![]() の分散よりも小さいことが分かります。
の分散よりも小さいことが分かります。