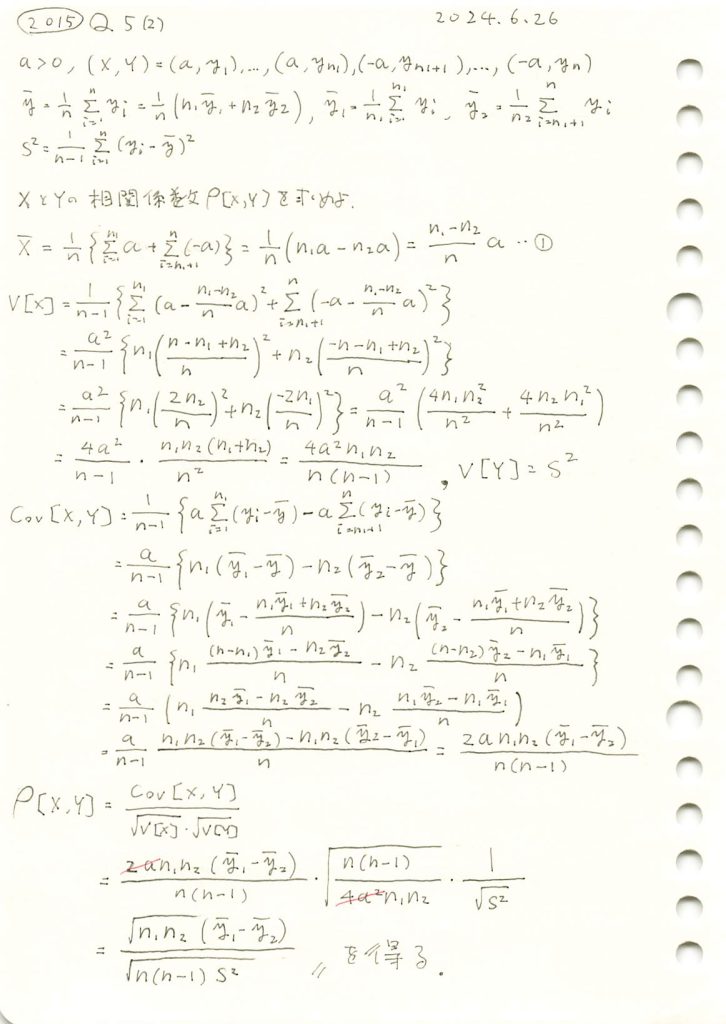
組標本の相関係数を、2つに分けられた組標本のそれぞれ平均と全体の不偏分散で表現しました。

コード
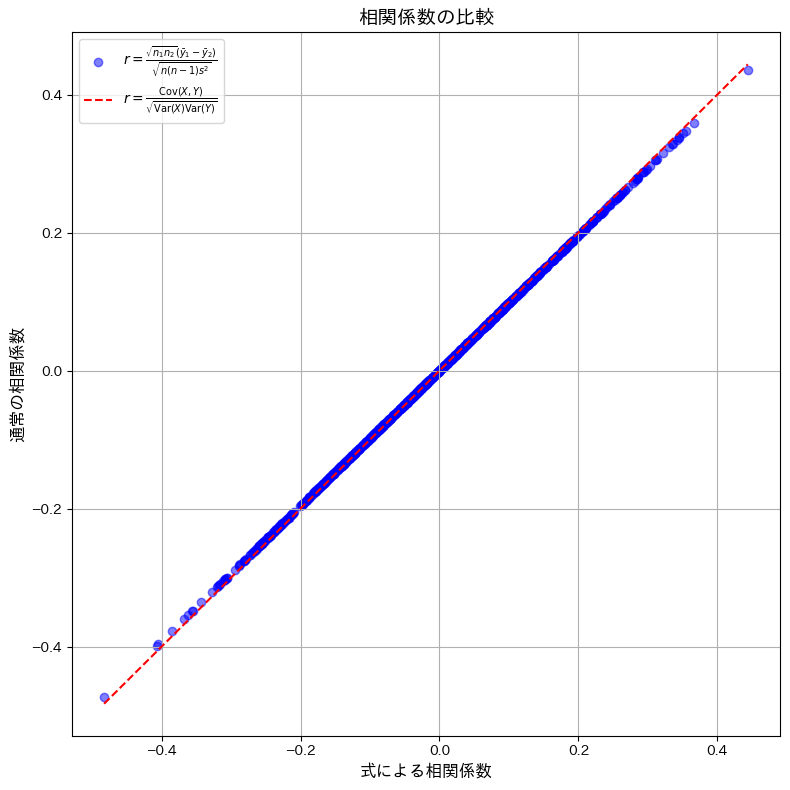
与えられた式を用いて計算した相関系数と、通常の定義式を用いて計算した相関係数が一致するかシミュレーションで確認をします。
# 2015 Q5(2)  2024.12.23

import numpy as np
import matplotlib.pyplot as plt

# シミュレーションパラメータ
n1 = 30  # グループ1のサンプル数
n2 = 20  # グループ2のサンプル数
n = n1 + n2  # 全体のサンプル数
simulations = 1000  # シミュレーションの回数

# 結果を格納するリスト
custom_r_values = []  # 式で計算した相関係数
standard_r_values = []  # 通常の相関係数

for _ in range(simulations):
    # y の生成 (正規分布)
    y1 = np.random.normal(0, 1, n1)
    y2 = np.random.normal(0, 1, n2)
    y = np.concatenate([y1, y2])

    # a の生成
    a_values = np.concatenate([np.full(n1, 1), np.full(n2, -1)])

    # 平均と分散
    y_bar = np.mean(y)
    s_sq_y = np.var(y, ddof=1)

    # 共分散
    covariance_manual = np.mean((y - y_bar) * (a_values - np.mean(a_values)))

    # 通常の相関係数
    standard_r = covariance_manual / np.sqrt(s_sq_y * np.var(a_values, ddof=1))
    standard_r_values.append(standard_r)

    # 式での相関係数
    y1_bar = np.mean(y1)
    y2_bar = np.mean(y2)
    numerator_custom = np.sqrt(n1 * n2) * (y1_bar - y2_bar)
    denominator_custom = np.sqrt(n * (n - 1) * s_sq_y)
    custom_r = numerator_custom / denominator_custom
    custom_r_values.append(custom_r)

# グラフの描画
plt.figure(figsize=(8, 8))
plt.scatter(custom_r_values, standard_r_values, alpha=0.5, color='blue', label=r"$r = \frac{\sqrt{n_1 n_2} (\bar{y}_1 - \bar{y}_2)}{\sqrt{n(n-1)s^2}}$")
plt.plot([min(custom_r_values), max(custom_r_values)], [min(custom_r_values), max(custom_r_values)], color='red', linestyle='--', label=r"$r = \frac{\mathrm{Cov}(X, Y)}{\sqrt{\mathrm{Var}(X)\mathrm{Var}(Y)}}$")
plt.title("相関係数の比較", fontsize=14)
plt.xlabel("式による相関係数", fontsize=12)
plt.ylabel("通常の相関係数", fontsize=12)
plt.legend()
plt.grid(True)
plt.tight_layout()
plt.show()
与えられた式を用いて計算した相関系数と、通常の定義式を用いて計算した相関係数が一致しました。わずかに観測された誤差は、浮動小数点演算による丸め誤差であると考えられます。