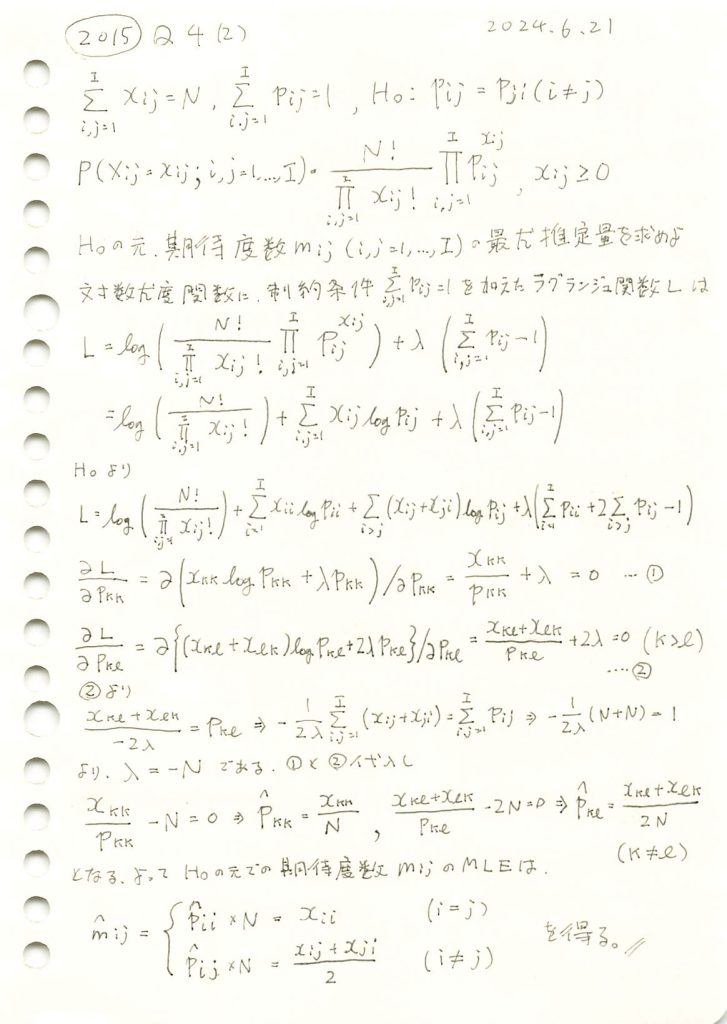
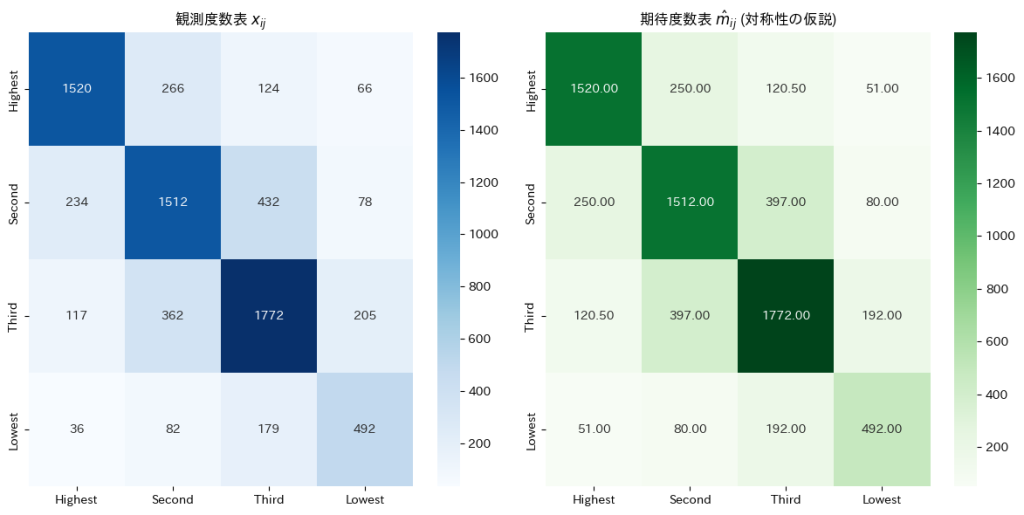
確率の分割表に対称性があるという仮説の下での期待度数の最尤推定を行いました。

与えられた観測度数表から![]() に基づき期待度数を求めます。
に基づき期待度数を求めます。
# 2015 Q4(2)  2024.12.18

import numpy as np
import pandas as pd
import matplotlib.pyplot as plt
import seaborn as sns

# 1. 観測度数表
observed_counts = np.array([[1520, 266, 124, 66],
                            [234, 1512, 432, 78],
                            [117, 362, 1772, 205],
                            [36, 82, 179, 492]])

# 2. 総サンプルサイズ N
N = observed_counts.sum()

# 3. 期待度数 m_ij の計算 (対称性の仮説)
m_ij = np.zeros_like(observed_counts, dtype=float)
I = observed_counts.shape[0]

for i in range(I):
    for j in range(I):
        if i == j:  # 対角要素
            m_ij[i, j] = observed_counts[i, j]
        else:  # 非対角要素
            m_ij[i, j] = (observed_counts[i, j] + observed_counts[j, i]) / 2

# 4. 観測度数と期待度数をDataFrameにまとめる
row_labels = col_labels = ["Highest", "Second", "Third", "Lowest"]
df_observed = pd.DataFrame(observed_counts, index=row_labels, columns=col_labels)
df_expected = pd.DataFrame(np.round(m_ij, 2), index=row_labels, columns=col_labels)

# 5. 観測度数と期待度数のヒートマップを作成
fig, axes = plt.subplots(1, 2, figsize=(12, 6))

# 観測度数のヒートマップ
sns.heatmap(df_observed, annot=True, fmt=".0f", cmap="Blues", ax=axes[0])
axes[0].set_title("観測度数表 $x_{ij}$")

# 期待度数のヒートマップ
sns.heatmap(df_expected, annot=True, fmt=".2f", cmap="Greens", ax=axes[1])
axes[1].set_title("期待度数表 $\hat{m}_{ij}$ (対称性の仮説)")

plt.tight_layout()
plt.show()
与えられた観測度数表から![]() に基づいて期待度数を求めると、非対角要素は対応する2つの観測度数の平均として表され、対角要素は観測度数そのものが期待度数となりました。
に基づいて期待度数を求めると、非対角要素は対応する2つの観測度数の平均として表され、対角要素は観測度数そのものが期待度数となりました。