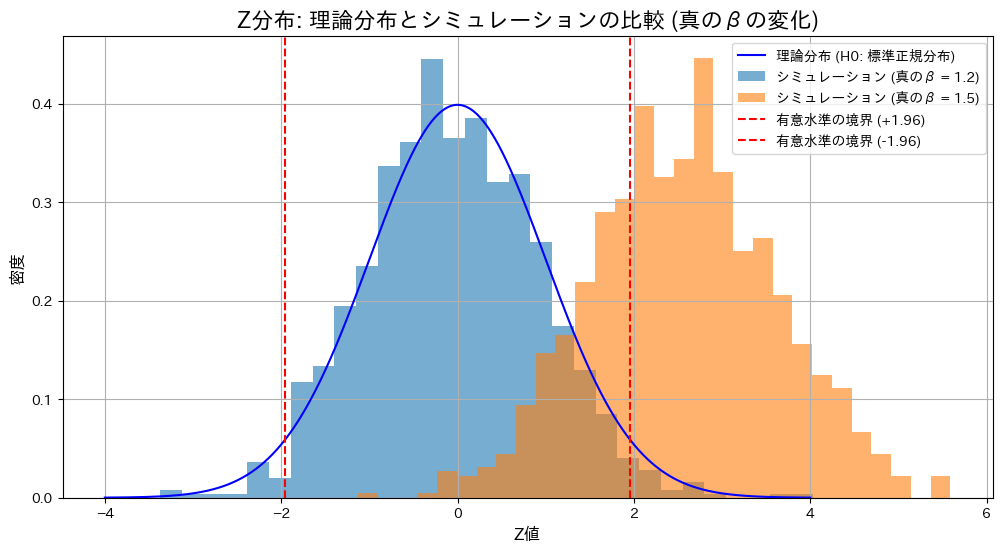
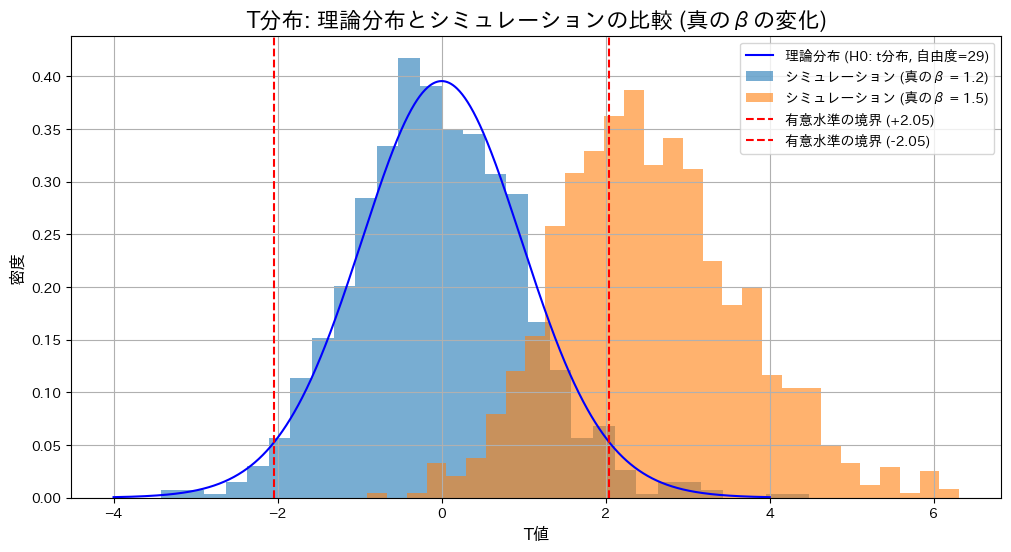
液体のサンプルの体積と重さから比重がβ0であるという検定を体積と重さの分散が既知の場合と未知の場合でそれぞれ方式を求めました。

コード
帰無仮説![]() の下で、真の値
の下で、真の値![]() が仮説と一致する場合(
が仮説と一致する場合(![]() )と異なる場合(
)と異なる場合(![]() )におけるZ検定とT検定の棄却率を比較します。
)におけるZ検定とT検定の棄却率を比較します。
# 2014 Q3(1)  2025.1.5 (2025.1.6修正)

import numpy as np
import matplotlib.pyplot as plt
from scipy.stats import norm, t

# Parameters
n = 30  # サンプルサイズ
beta_0 = 1.2  # 仮説のβ
sigma_X = 1.0  # Xの標準偏差
sigma_Y = 3.0  # Yの標準偏差
mu_X = 5.0  # Xの平均 (十分大きく設定)
alpha = 0.05  # 有意水準
num_simulations = 1000  # シミュレーション回数

# 分散の妥当性を確認
beta_true_values = [1.2, 1.5]  # 真のβの候補

# 結果を格納するリスト
simulated_Z_dict = {}
simulated_T_dict = {}
rejection_rates_Z = {}
rejection_rates_T = {}

for beta_true in beta_true_values:
    if sigma_Y**2 <= (beta_true * sigma_X)**2:
        raise ValueError(f"sigma_Y^2は(beta_true * sigma_X)^2より大きくなければなりません (beta_true={beta_true})。")

    # 誤差項の分散を計算
    sigma_epsilon_squared = sigma_Y**2 + (beta_true * sigma_X)**2

    # Z統計量とT統計量を格納するリスト
    simulated_Z = []
    simulated_T = []
    reject_count_Z = 0
    reject_count_T = 0

    for _ in range(num_simulations):
        # Xを正規分布で生成
        X = np.random.normal(mu_X, sigma_X, n)  # 平均mu_X、標準偏差sigma_X
        epsilon = np.random.normal(0, np.sqrt(sigma_epsilon_squared), n)  # 誤差項

        # Yを生成
        Y = beta_true * X + epsilon

        # Z検定 (分散既知)
        X_bar = np.mean(X)
        Y_bar = np.mean(Y)
        Z = (Y_bar - beta_0 * X_bar) / np.sqrt((sigma_Y**2 + beta_0**2 * sigma_X**2) / n)
        simulated_Z.append(Z)
        if abs(Z) > norm.ppf(1 - alpha / 2):  # 両側検定
            reject_count_Z += 1

        # T検定 (分散未知)
        U = Y - beta_0 * X
        U_bar = np.mean(U)
        S_square = np.sum((U - U_bar)**2) / (n - 1)
        T = (Y_bar - beta_0 * X_bar) / np.sqrt(S_square / n)
        simulated_T.append(T)
        if abs(T) > t.ppf(1 - alpha / 2, df=n - 1):  # 両側検定
            reject_count_T += 1

    simulated_Z_dict[beta_true] = simulated_Z
    simulated_T_dict[beta_true] = simulated_T
    rejection_rates_Z[beta_true] = reject_count_Z / num_simulations
    rejection_rates_T[beta_true] = reject_count_T / num_simulations

# 棄却率を表示
print("検定条件: H0: β = 1.2")
for beta_true in beta_true_values:
    print(f"真のβ = {beta_true}: Z検定の棄却率 = {rejection_rates_Z[beta_true]:.4f}, T検定の棄却率 = {rejection_rates_T[beta_true]:.4f}")

# グラフ用の範囲を定義
x_values = np.linspace(-4, 4, 1000)

# 理論的なZ分布 (帰無仮説H0: beta = beta_0)
z_pdf = norm.pdf(x_values, 0, 1)

# Z分布のプロット
plt.figure(figsize=(12, 6))
plt.plot(x_values, z_pdf, label="理論分布 (H0: 標準正規分布)", color='blue')
for beta_true, simulated_Z in simulated_Z_dict.items():
    plt.hist(simulated_Z, bins=30, density=True, alpha=0.6, label=f"シミュレーション (真のβ = {beta_true})")
plt.axvline(x=norm.ppf(1 - alpha / 2), color='red', linestyle='dashed', label=f"有意水準の境界 (+{norm.ppf(1 - alpha / 2):.2f})")
plt.axvline(x=-norm.ppf(1 - alpha / 2), color='red', linestyle='dashed', label=f"有意水準の境界 (-{norm.ppf(1 - alpha / 2):.2f})")
plt.title("Z分布: 理論分布とシミュレーションの比較 (真のβの変化)", fontsize=16)
plt.xlabel("Z値", fontsize=12)
plt.ylabel("密度", fontsize=12)
plt.legend()
plt.grid()
plt.show()

# 理論的なT分布 (帰無仮説H0: beta = beta_0)
t_pdf = t.pdf(x_values, df=n - 1)

# T分布のプロット
plt.figure(figsize=(12, 6))
plt.plot(x_values, t_pdf, label=f"理論分布 (H0: t分布, 自由度={n - 1})", color='blue')
for beta_true, simulated_T in simulated_T_dict.items():
    plt.hist(simulated_T, bins=30, density=True, alpha=0.6, label=f"シミュレーション (真のβ = {beta_true})")
plt.axvline(x=t.ppf(1 - alpha / 2, df=n - 1), color='red', linestyle='dashed', label=f"有意水準の境界 (+{t.ppf(1 - alpha / 2, df=n - 1):.2f})")
plt.axvline(x=-t.ppf(1 - alpha / 2, df=n - 1), color='red', linestyle='dashed', label=f"有意水準の境界 (-{t.ppf(1 - alpha / 2, df=n - 1):.2f})")
plt.title("T分布: 理論分布とシミュレーションの比較 (真のβの変化)", fontsize=16)
plt.xlabel("T値", fontsize=12)
plt.ylabel("密度", fontsize=12)
plt.legend()
plt.grid()
plt.show()
検定条件: H0: β = 1.2
真のβ = 1.2: Z検定の棄却率 = 0.0390, T検定の棄却率 = 0.0400
真のβ = 1.5: Z検定の棄却率 = 0.7080, T検定の棄却率 = 0.6490

帰無仮説が正しい場合(![]() )、Z検定とT検定の棄却率は有意水準付近で期待通りの結果を示しました。一方、真の値が異なる場合(
)、Z検定とT検定の棄却率は有意水準付近で期待通りの結果を示しました。一方、真の値が異なる場合(![]() )、両検定で棄却域が大幅に上昇し、帰無仮説を適切に棄却できていることが確認されました。また、真の値が異なる場合には、Z検定の棄却率がT検定をわずかに上回る結果となりました。これは、分散既知の場合のZ検定が分散未知のT検定に比べて統計量の推定が安定しているためと考えられます。
)、両検定で棄却域が大幅に上昇し、帰無仮説を適切に棄却できていることが確認されました。また、真の値が異なる場合には、Z検定の棄却率がT検定をわずかに上回る結果となりました。これは、分散既知の場合のZ検定が分散未知のT検定に比べて統計量の推定が安定しているためと考えられます。