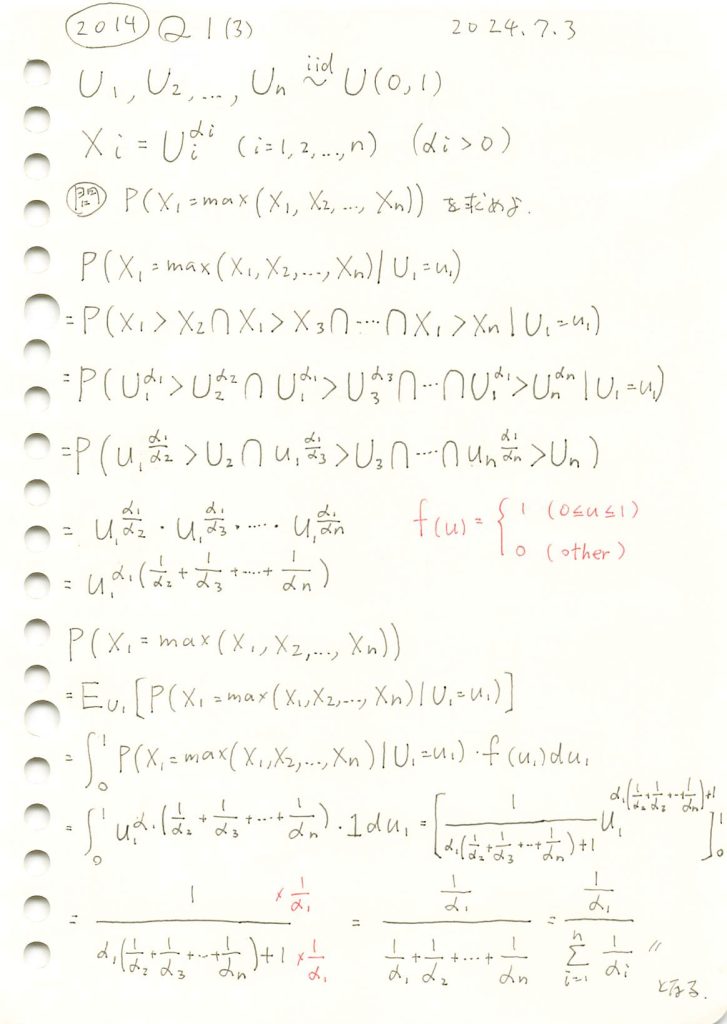
一様分布の指数を取るn個の確率変数のうち特定の一つが最大値をとる確率を求めました。

コード
与式は![]() と考え、
と考え、![]() とした場合の
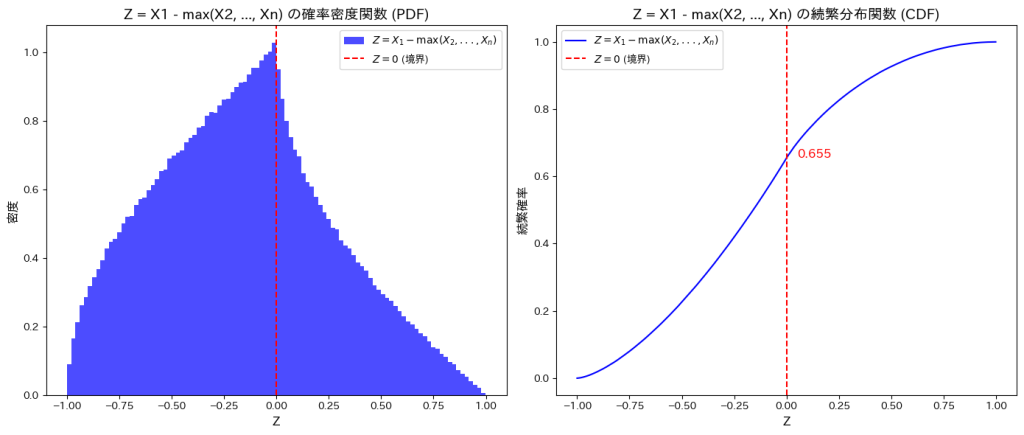
とした場合の![]() をシミュレーションで計算し、理論値と比較します。
をシミュレーションで計算し、理論値と比較します。
# 2014 Q1(3)  2024.12.30

import numpy as np
import matplotlib.pyplot as plt

# シミュレーションの設定
n_simulations = 10**6

# 確率変数の数とパラメータの設定
n = 5
alphas = [2, 3, 4, 5, 6]  # α1, α2, ..., αn

# 一様分布からサンプリング
U = np.random.uniform(0, 1, (n_simulations, n))
X = U**np.array(alphas)

# 確率変数 Z を計算 (Z = X1 - max(X2, ..., Xn))
Z_diff = X[:, 0] - np.max(X[:, 1:], axis=1)

# Z の累積分布関数 (CDF) を計算
z_sorted = np.sort(Z_diff)
cdf_Z = np.arange(1, len(z_sorted) + 1) / len(z_sorted)

# Z = 0 の累積確率を計算
cumulative_prob_at_zero = cdf_Z[np.searchsorted(z_sorted, 0)]

# 理論値の計算
theoretical_prob = (1 / alphas[0]) / sum(1 / alpha for alpha in alphas)

# 結果を出力
print(f"Z = 0 における続繁確率: {cumulative_prob_at_zero:.3f}")
print(f"シミュレーション結果: P(X1 > max(X2, ..., Xn)) = {1 - cumulative_prob_at_zero:.6f}")
print(f"理論値: P(X1 > max(X2, ..., Xn)) = {theoretical_prob:.6f}")
print(f"誤差: {abs((1 - cumulative_prob_at_zero) - theoretical_prob):.6f}")

# PDF および CDF のプロット (PDF にも Z = 0 の赤い線を追加)
plt.figure(figsize=(14, 6))

# PDF
plt.subplot(1, 2, 1)
plt.hist(Z_diff, bins=100, density=True, alpha=0.7, label=r'$Z = X_1 - \max(X_2, ..., X_n)$', color='blue')
plt.axvline(x=0, color='red', linestyle='--', label=r'$Z = 0$ (境界)')  # Z = 0 の赤い線を追加
plt.title('Z = X1 - max(X2, ..., Xn) の確率密度関数 (PDF)', fontsize=14)
plt.xlabel('Z', fontsize=12)
plt.ylabel('密度', fontsize=12)
plt.legend()

# CDF
plt.subplot(1, 2, 2)
plt.plot(z_sorted, cdf_Z, label=r'$Z = X_1 - \max(X_2, ..., X_n)$', color='blue')
plt.axvline(x=0, color='red', linestyle='--', label=r'$Z = 0$ (境界)')  # Z = 0 の赤い線
plt.text(0.05, cumulative_prob_at_zero, f'{cumulative_prob_at_zero:.3f}', color='red', fontsize=12)
plt.title('Z = X1 - max(X2, ..., Xn) の続繁分布関数 (CDF)', fontsize=14)
plt.xlabel('Z', fontsize=12)
plt.ylabel('続繁確率', fontsize=12)
plt.legend()

plt.tight_layout()
plt.show()
Z = 0 における続繁確率: 0.655
シミュレーション結果: P(X1 > max(X2, ..., Xn)) = 0.345030
理論値: P(X1 > max(X2, ..., Xn)) = 0.344828
誤差: 0.000202
![]() はシミュレーションの結果、理論値と一致しました。
はシミュレーションの結果、理論値と一致しました。